Navigating V-Dem Graphing Tools for Democracy Indices Part 1
V-Dem
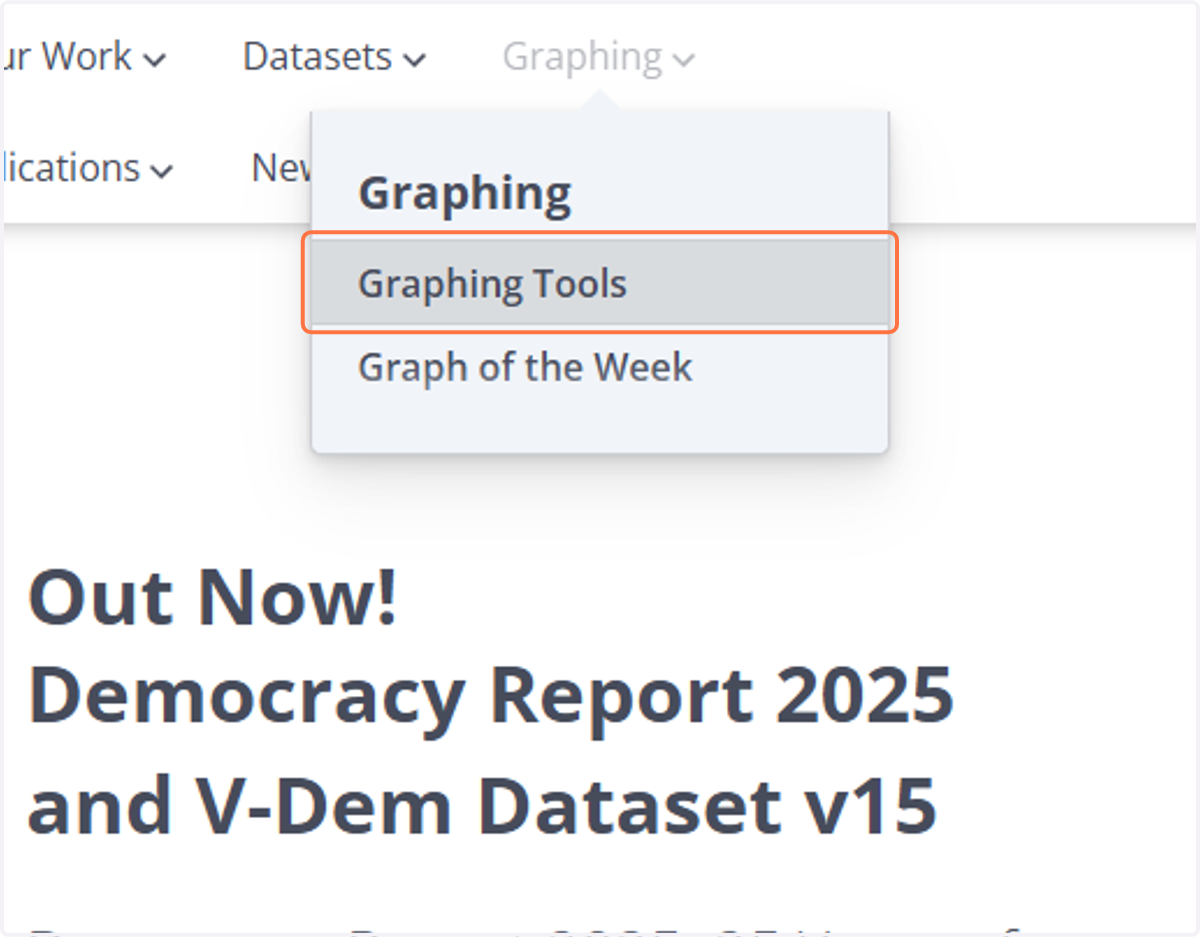
1. Click on Graphing Tools
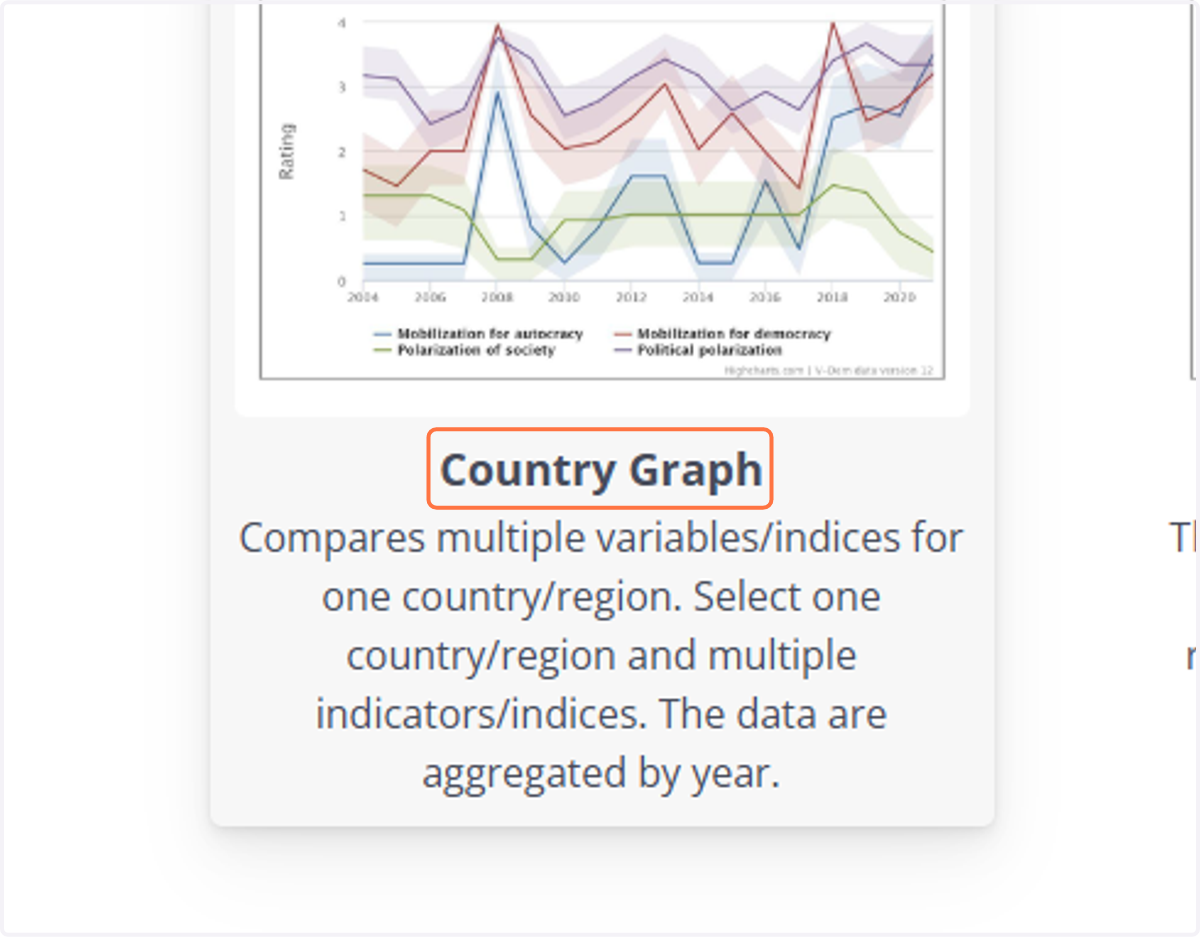
2. Click on Country Graph
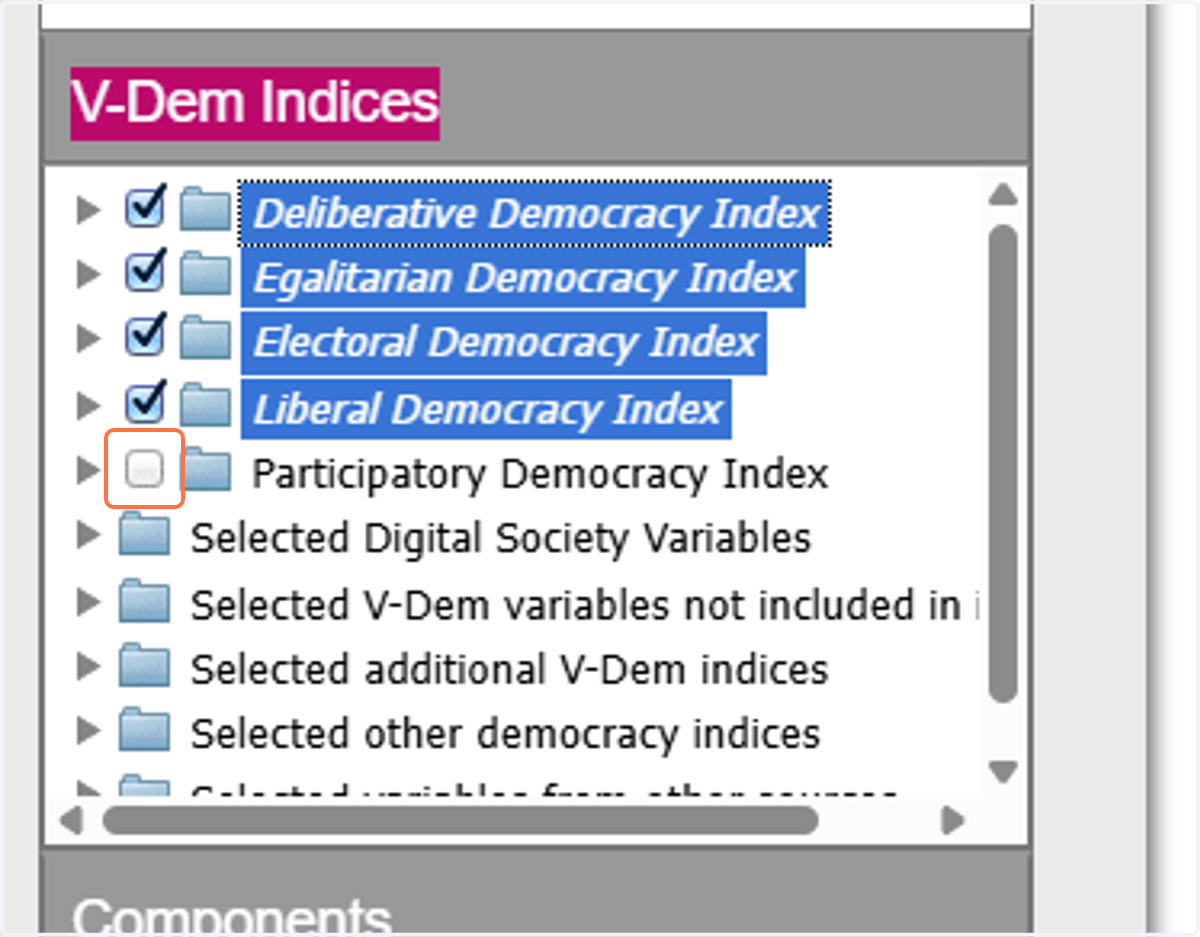
3. Choose Russia as your country, then click on the V-Dem Indices
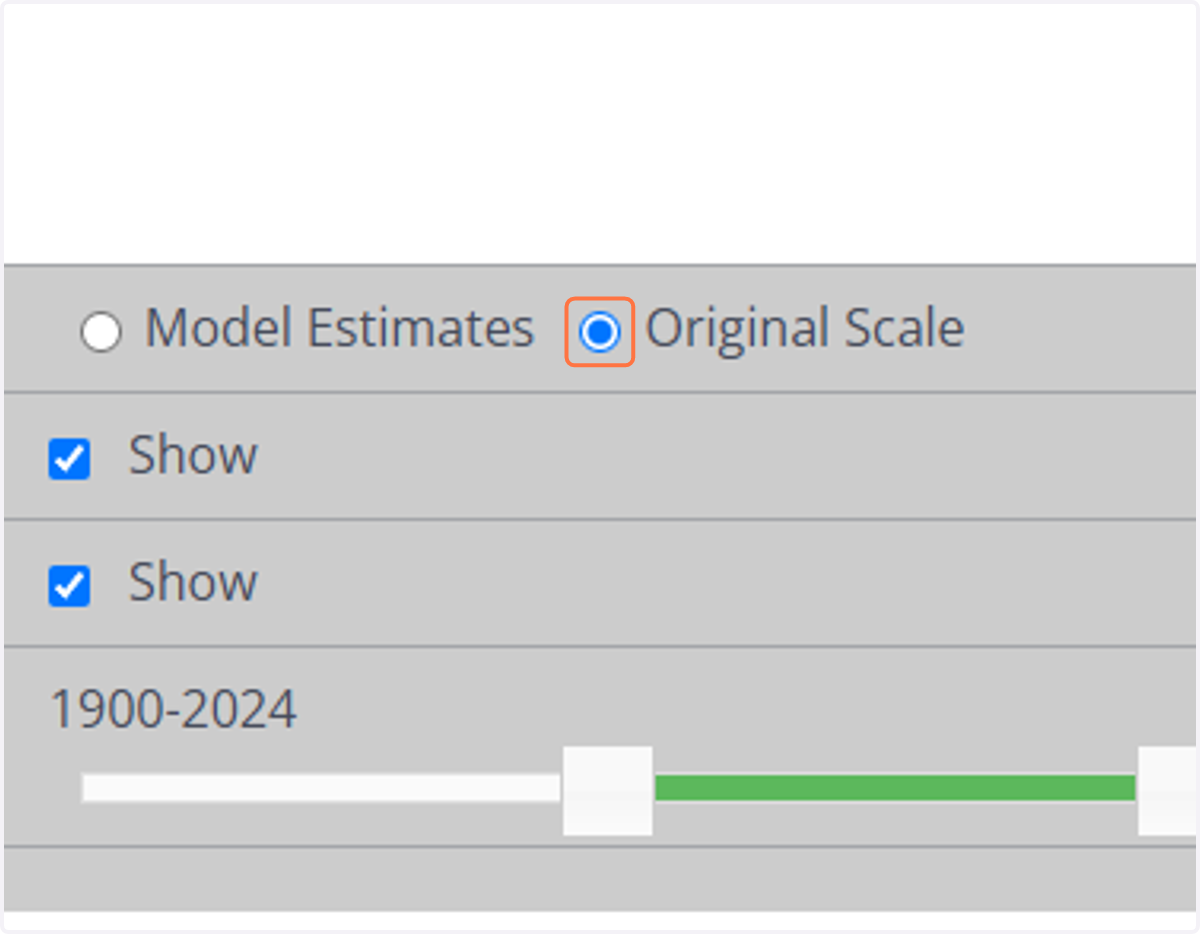
4. Select Original Scale, click show next to confidence intervals to remove them, and use the slider to pick your years
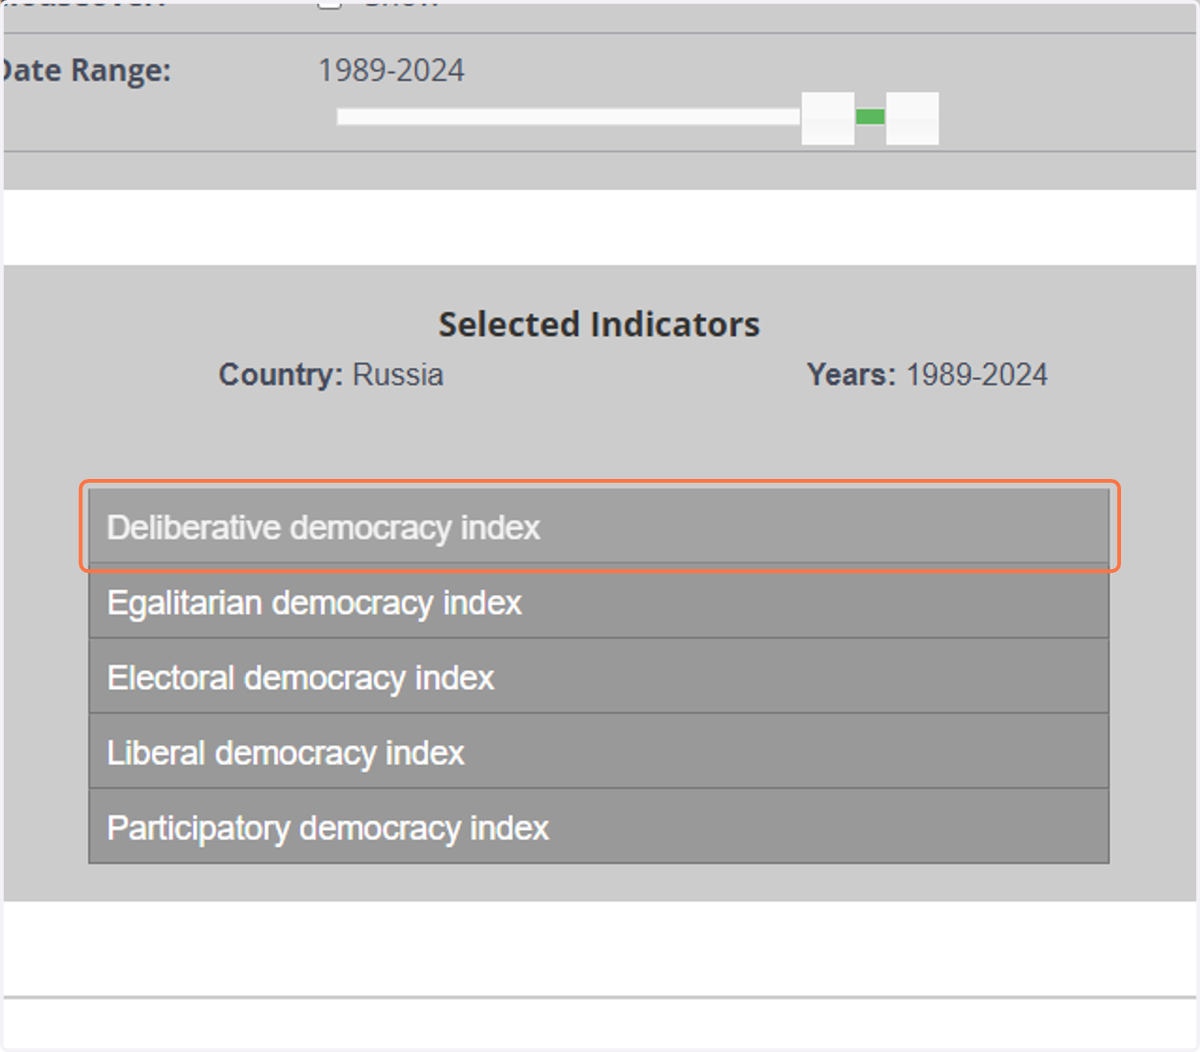
5. Learn about the indicators
Go down and click on the indicator you want to learn about.
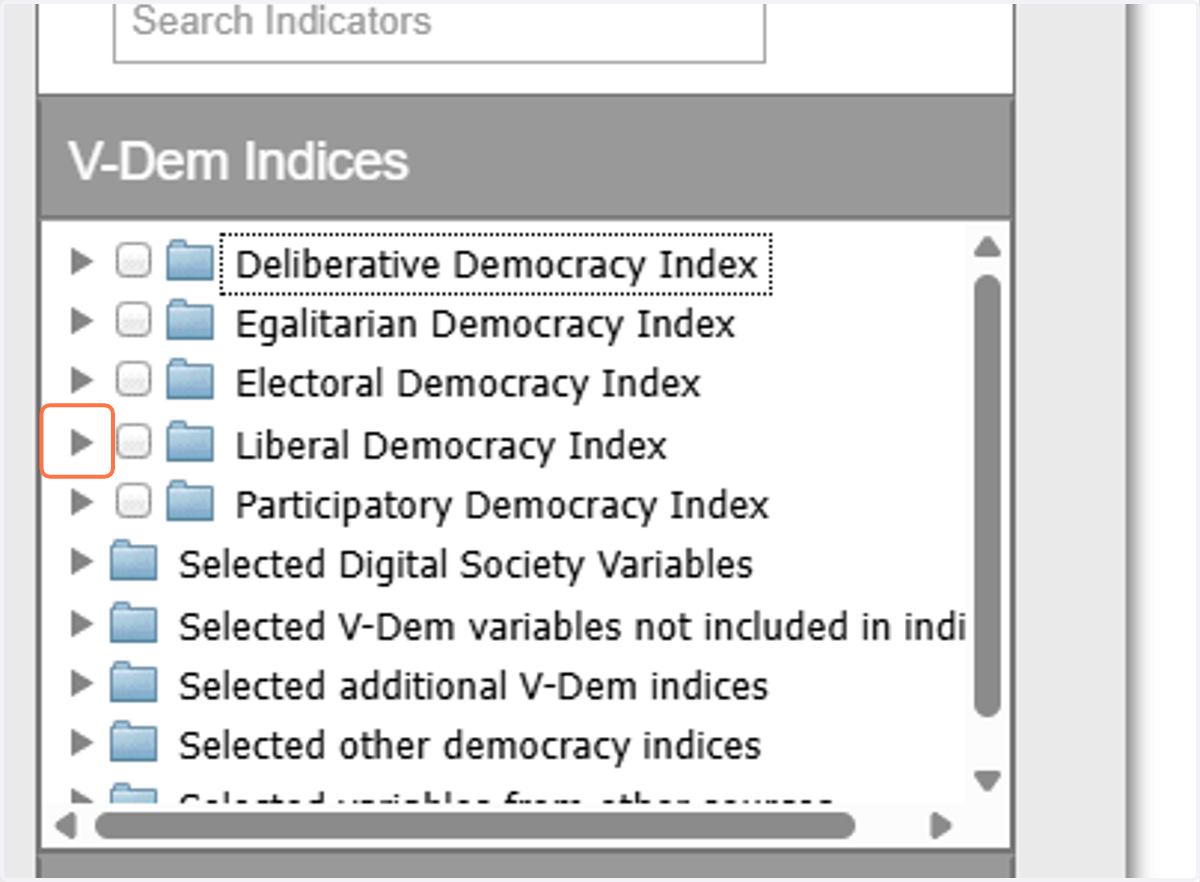
6. How to "drill down"
Click on the carrot next to the liberal democracy index after you have cleared the previous work.
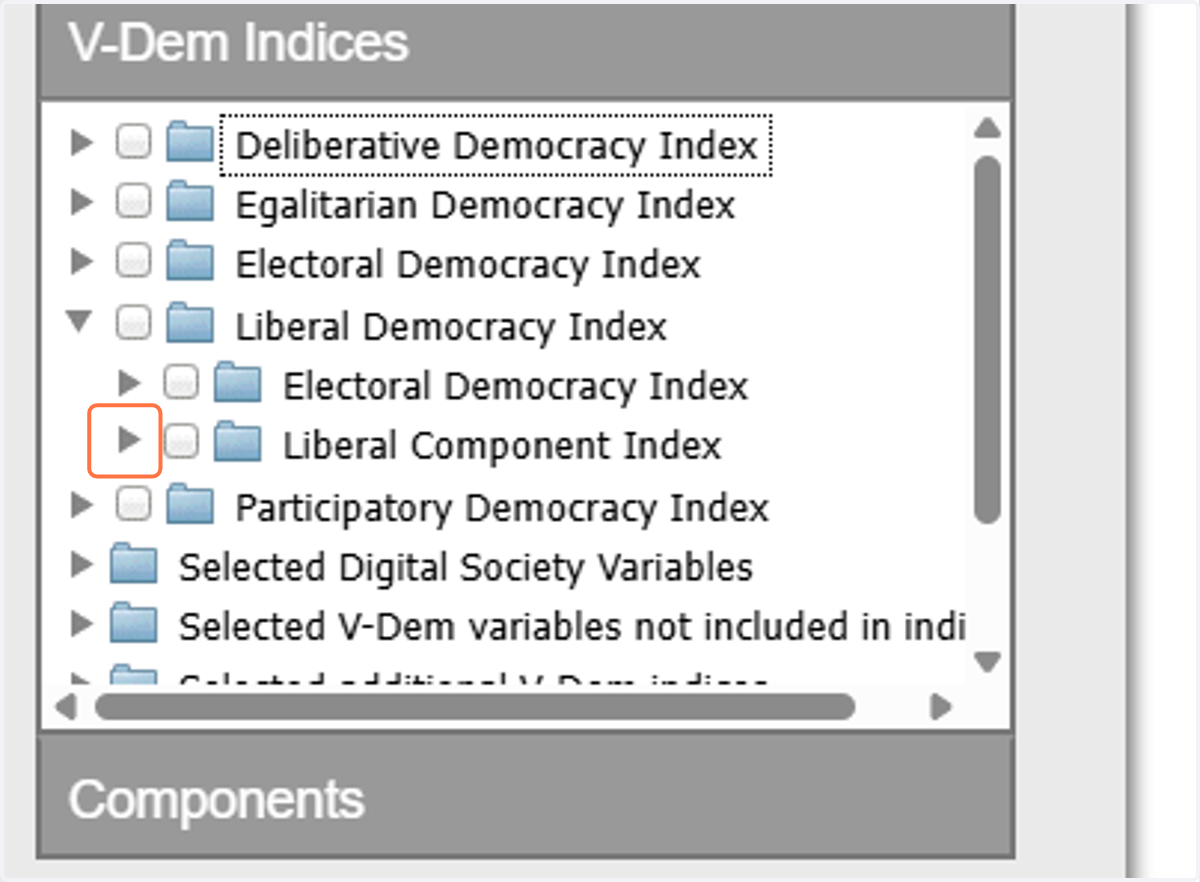
7. Continue to open the liberal component index
8. Click here to drill down even more!
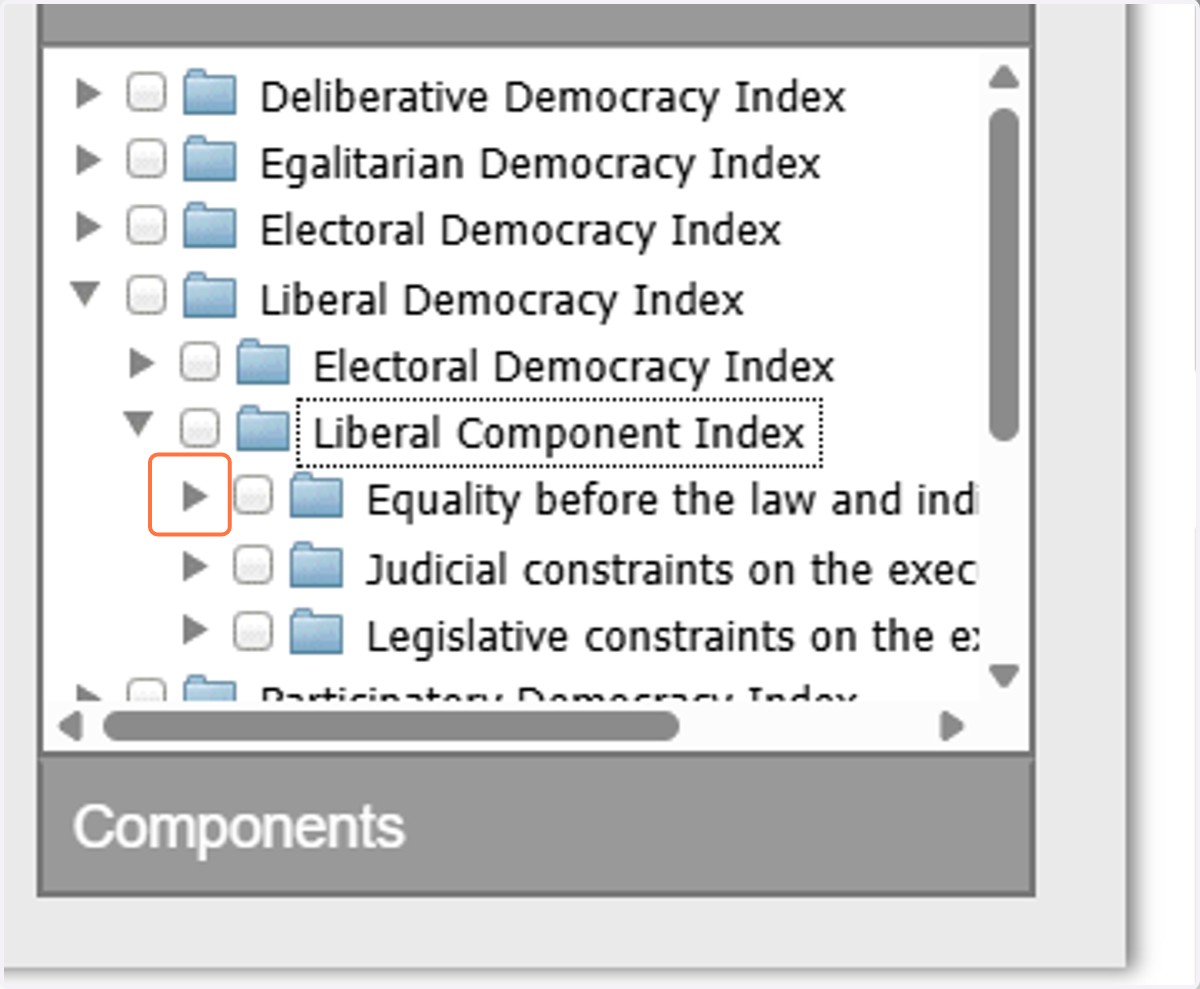
9. Click on Access to justice
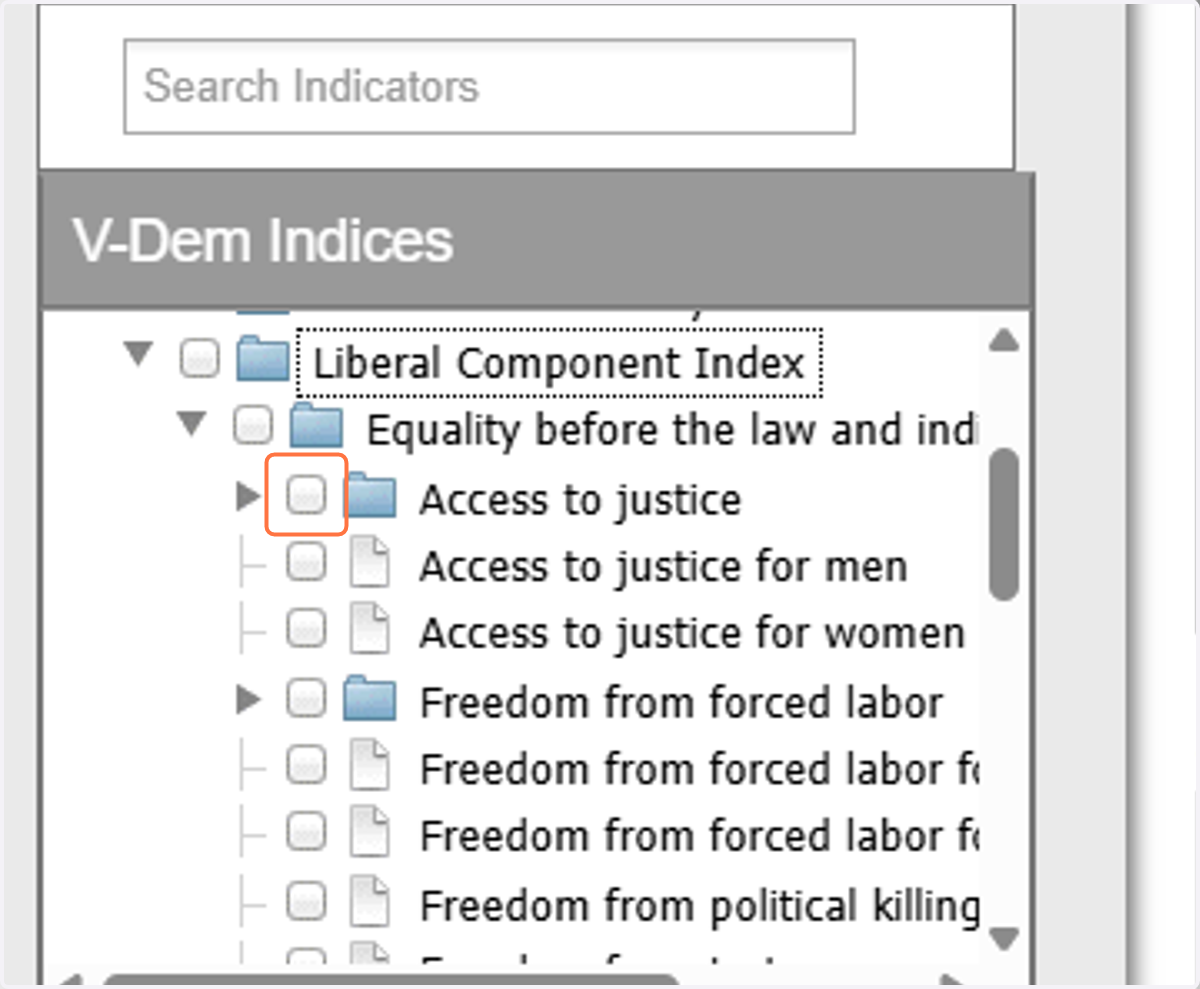
10. Click on Freedom from political killings
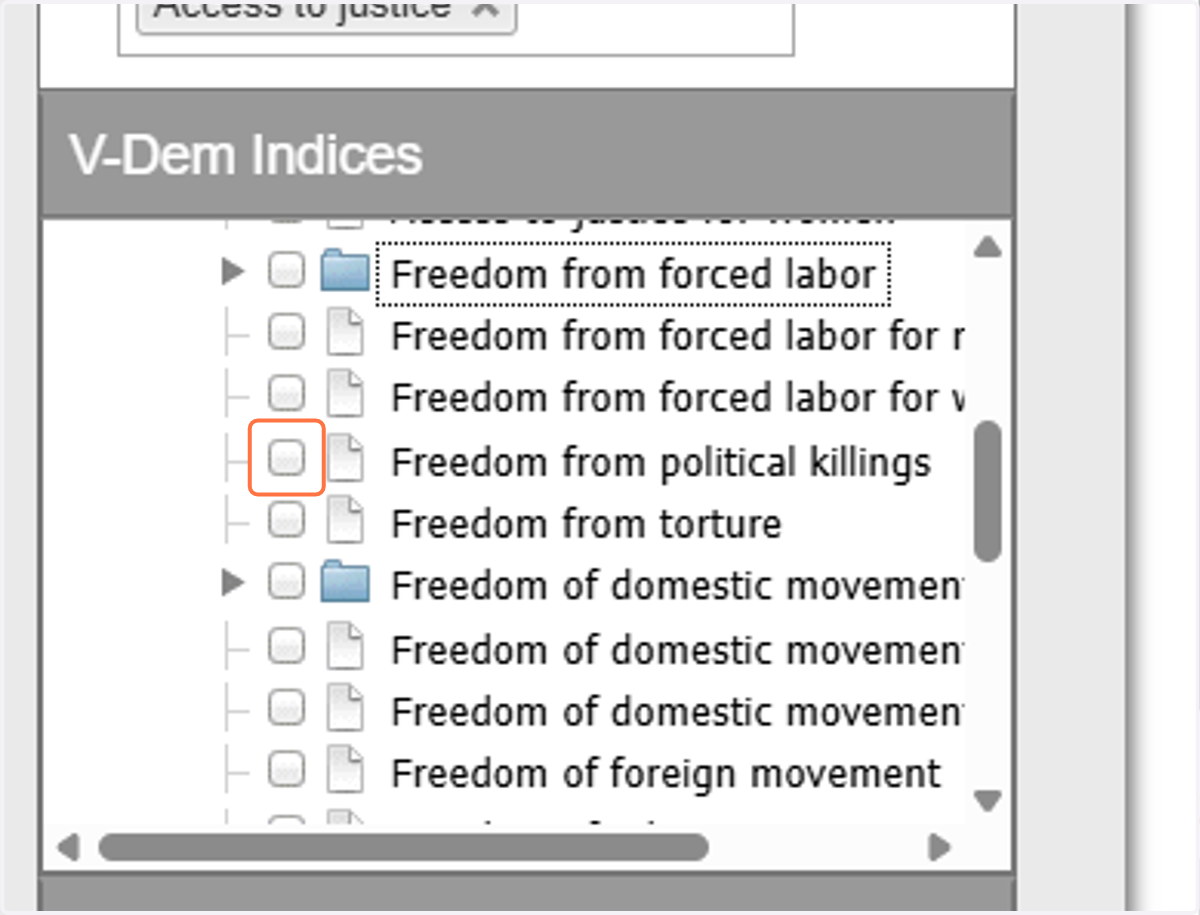
11. Click on Freedom from torture
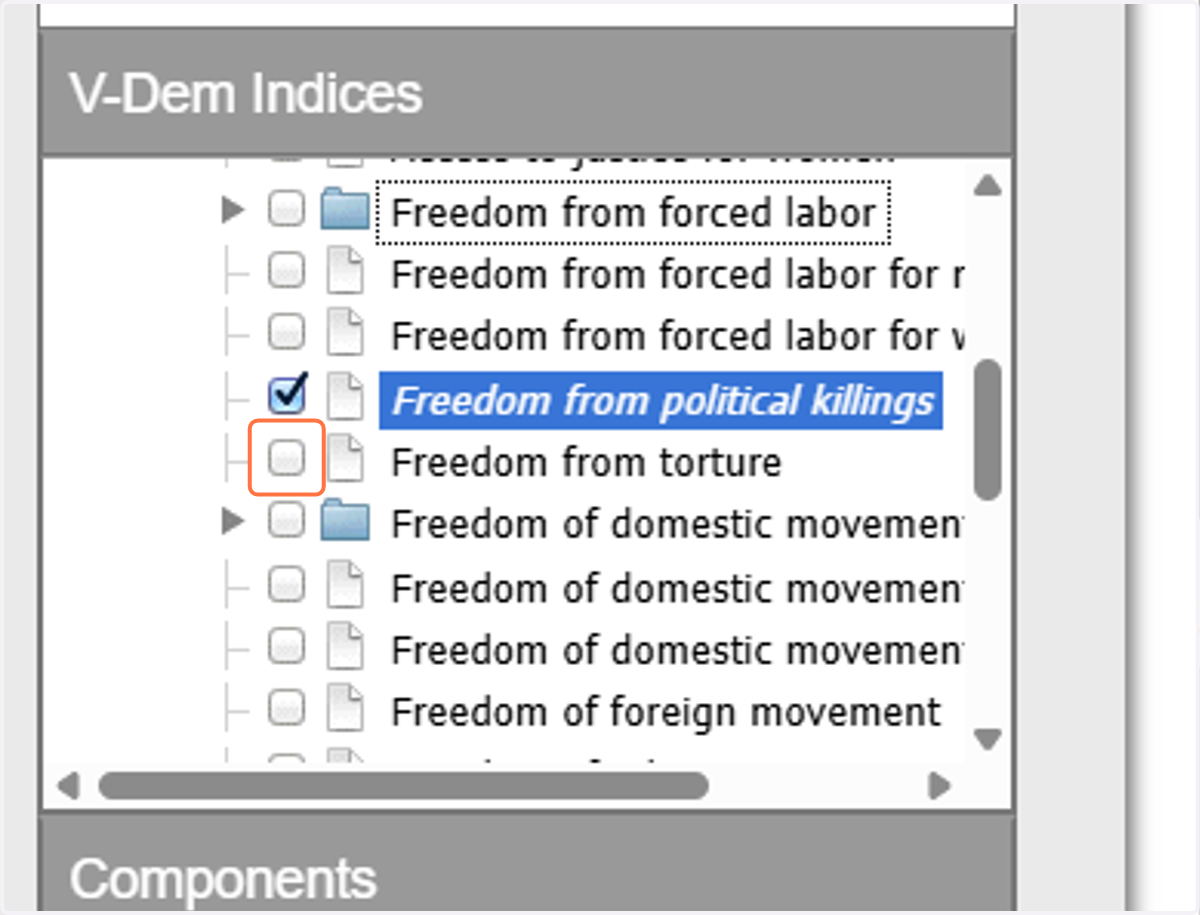
12. Click on Property rights
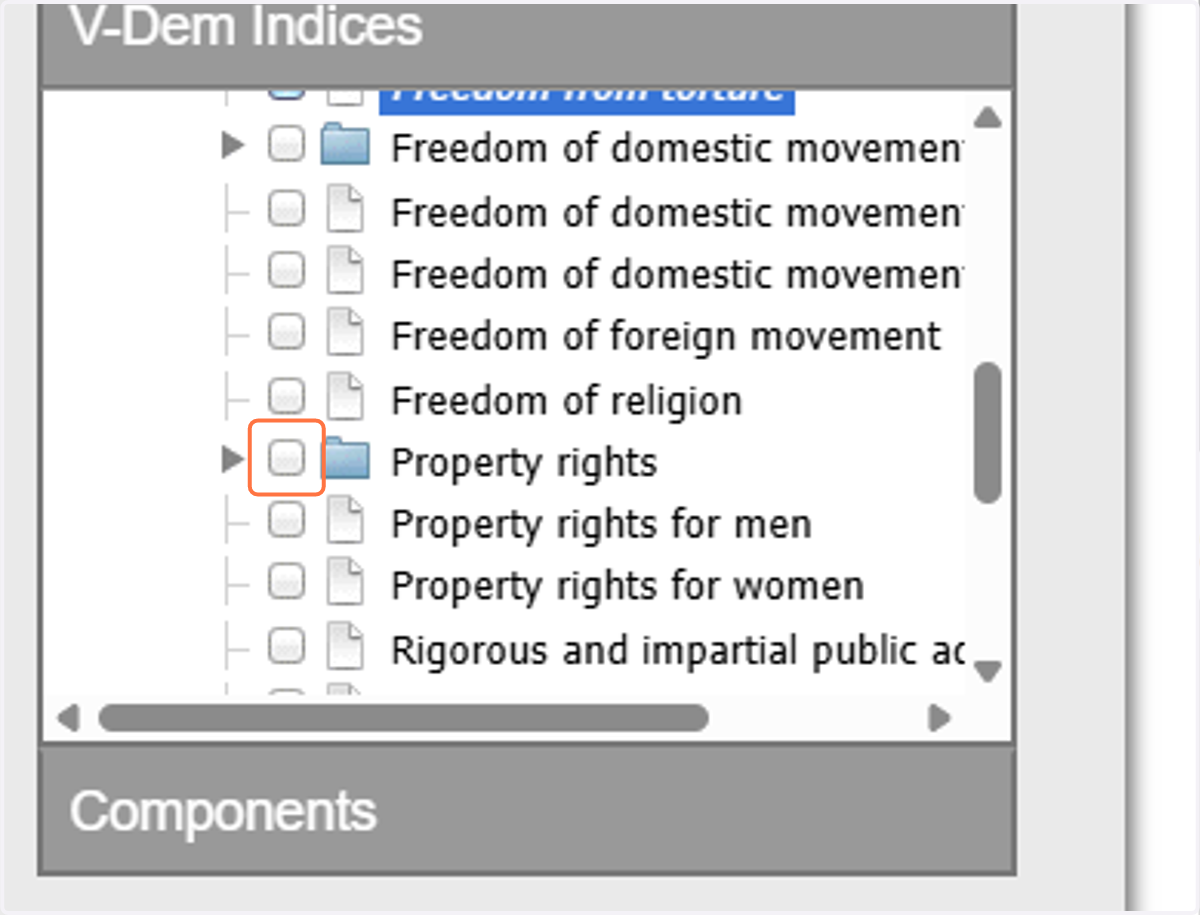
13. Click on Freedom of religion
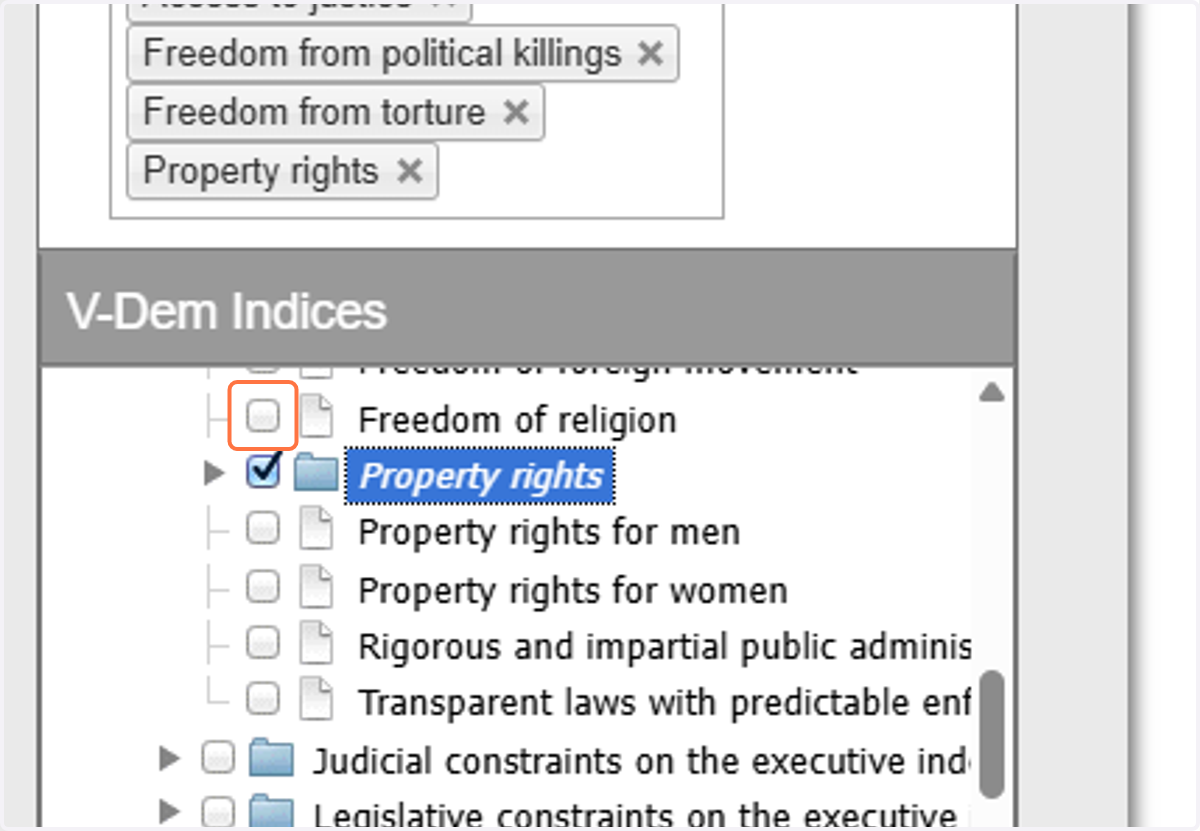
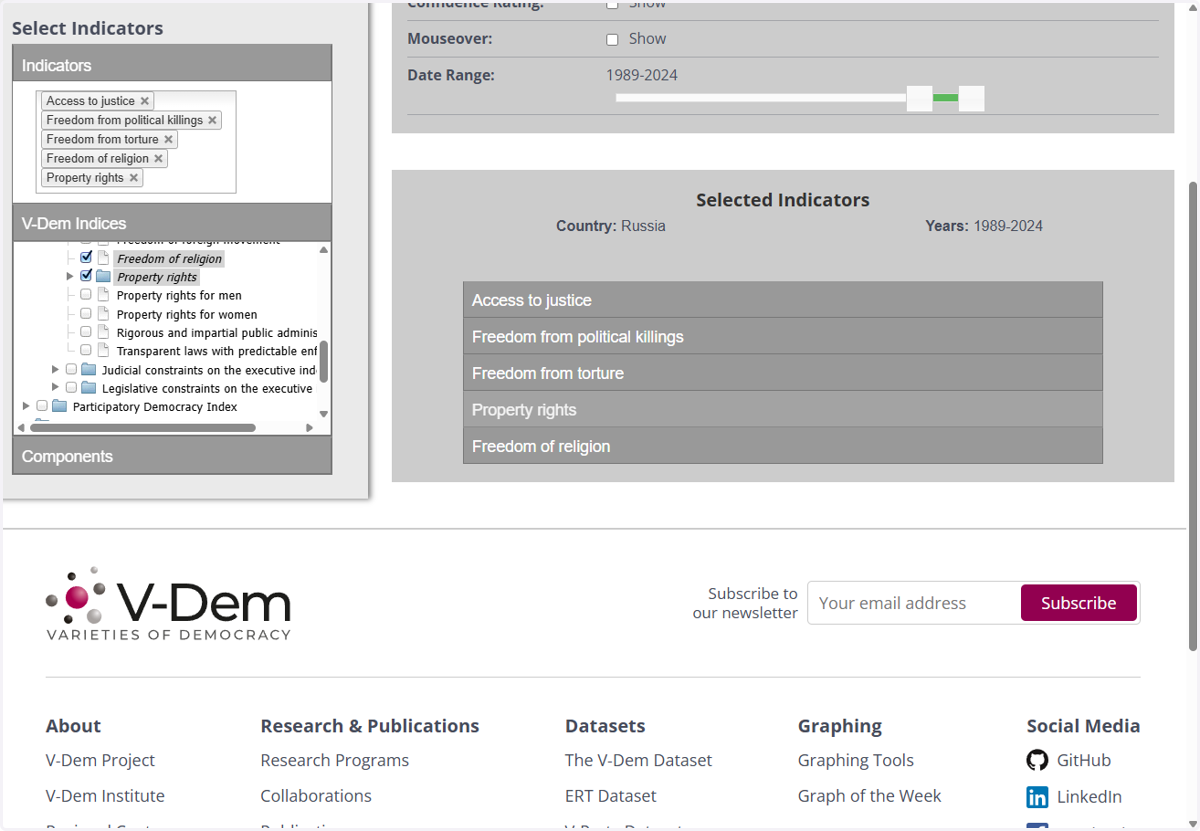
14. Select Model Estimates
15. Click on Access to justice
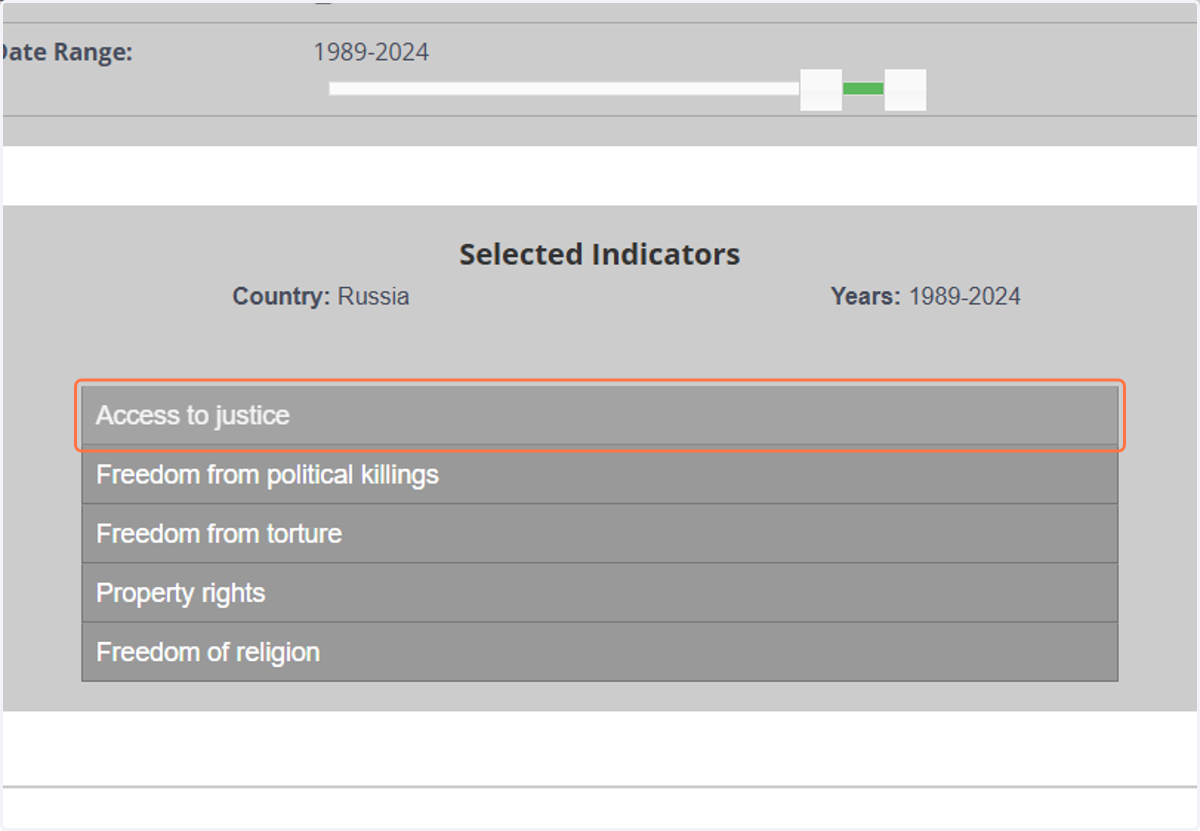
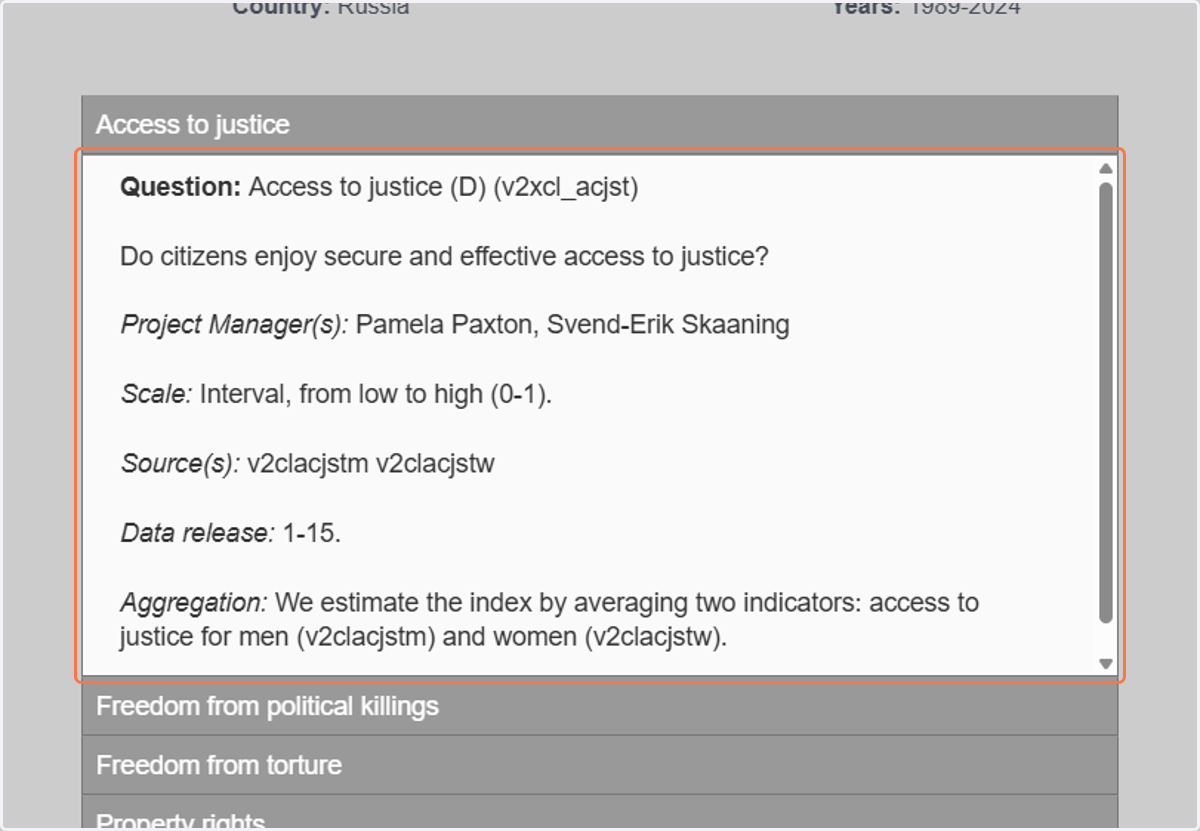
16. Read about the measurement scale.
Look at the scale. Here it says it is interval from 0-1. This means that it's basically a percentage- you could be .232, .45, .002, etc- meaning they use the whole number line between 0-1, making it an interval. If it was 0: Never 1: Sometimes 2: Often.... this would be a categorical variable, and it would ONLY be one of the numbers listed; you couldn't get a 2.3