How to create and modify graphs in ThoughtSpot
This tutorial starts after the user has logged on and has opened the chapter membership- new Livebaord. The user has scrolled to the bottom to the chapter membership- new list and has clicked "make a copy" in the top right corner of that table. This tutorial will show the certificates new members have visualized in a graph and pie chart.
For the purpose of this tutorial, some information has been omitted. However, you can modify this report to fit your criteria.
ThoughtSpot
1. Click on Cert Type Name
This is to add cert types for new members to this report
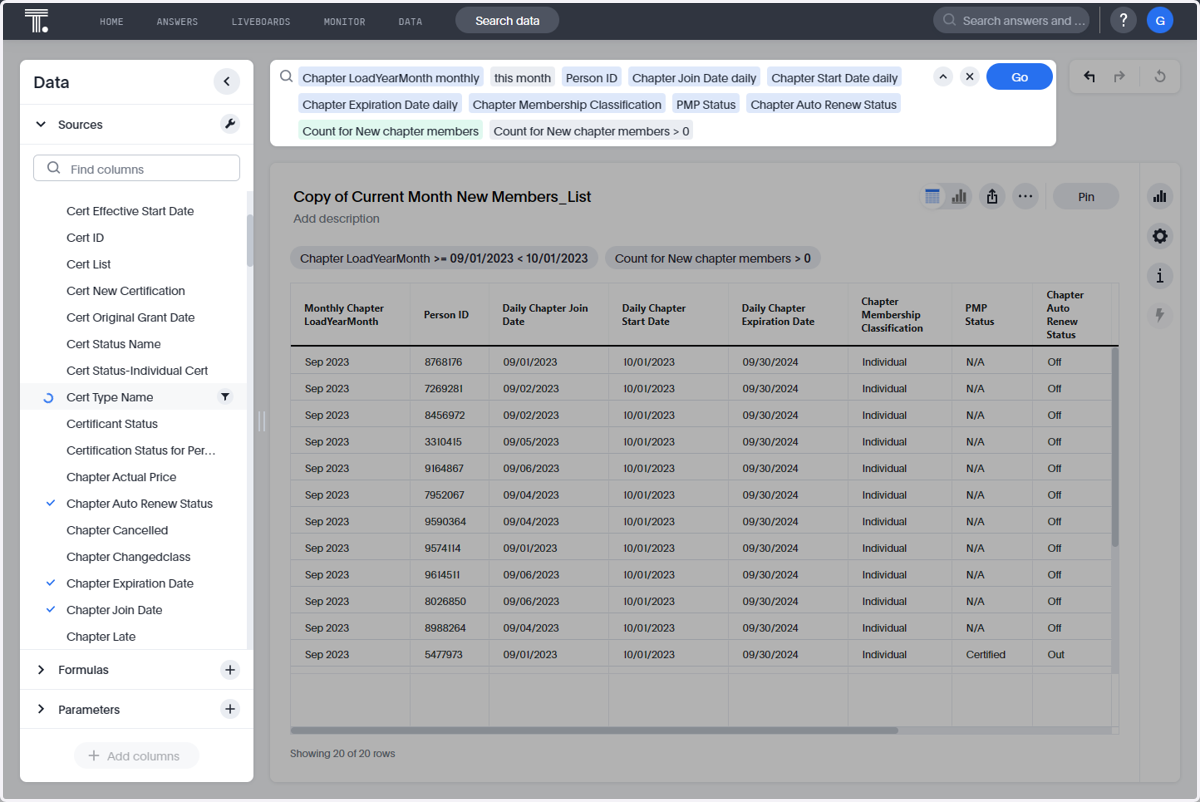
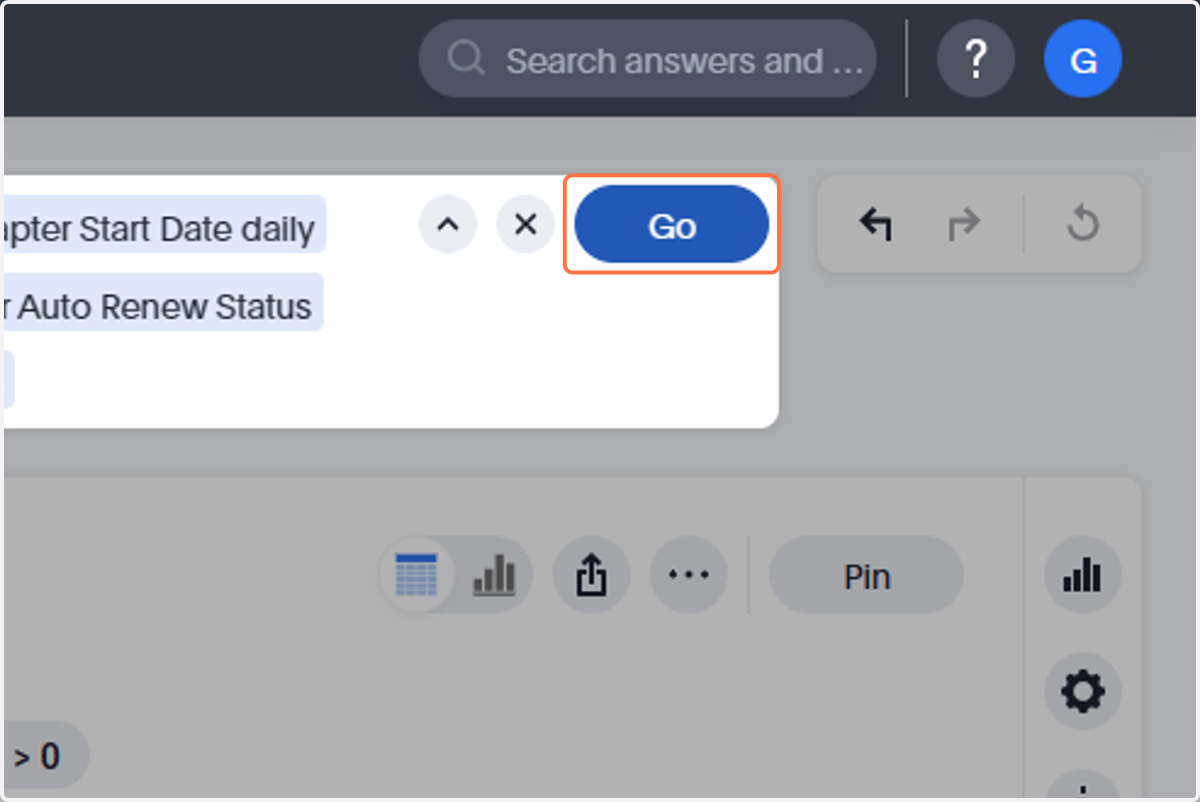
2. Click on Go
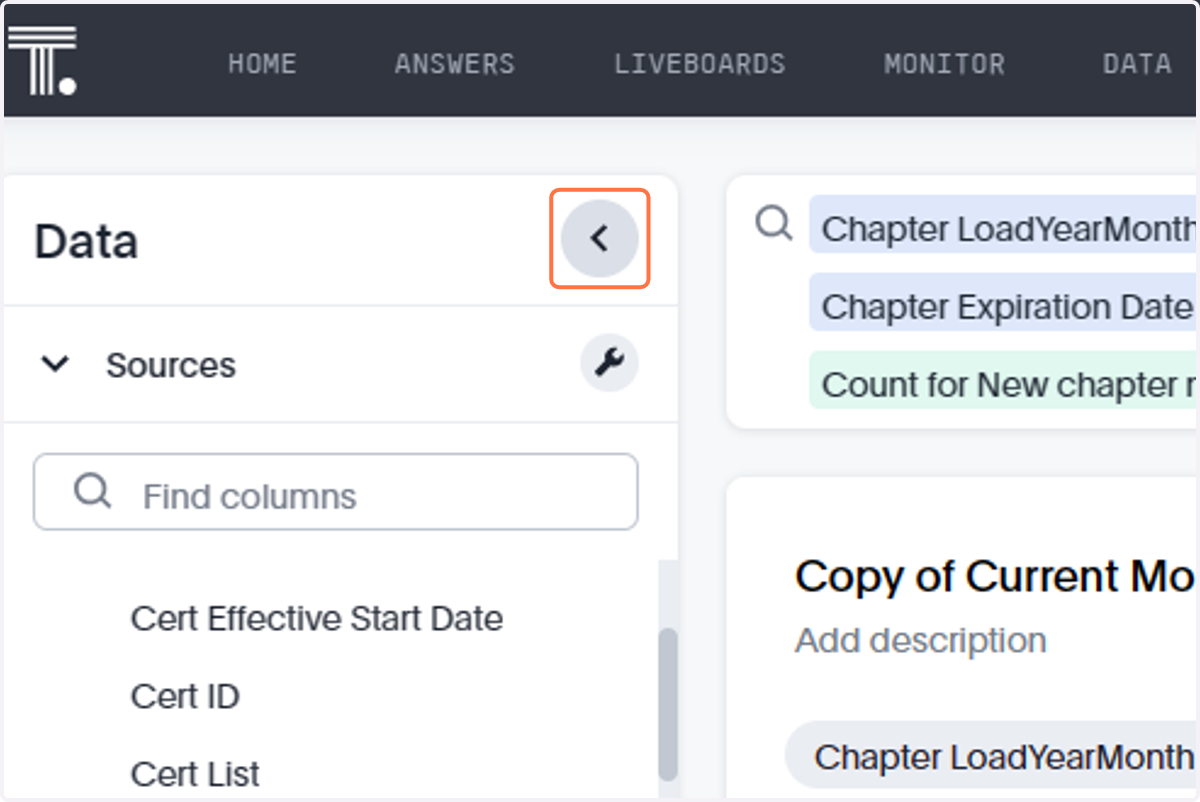
3. Click on collapse
4. Click on View chart
Doing this will switch you over to the graph view
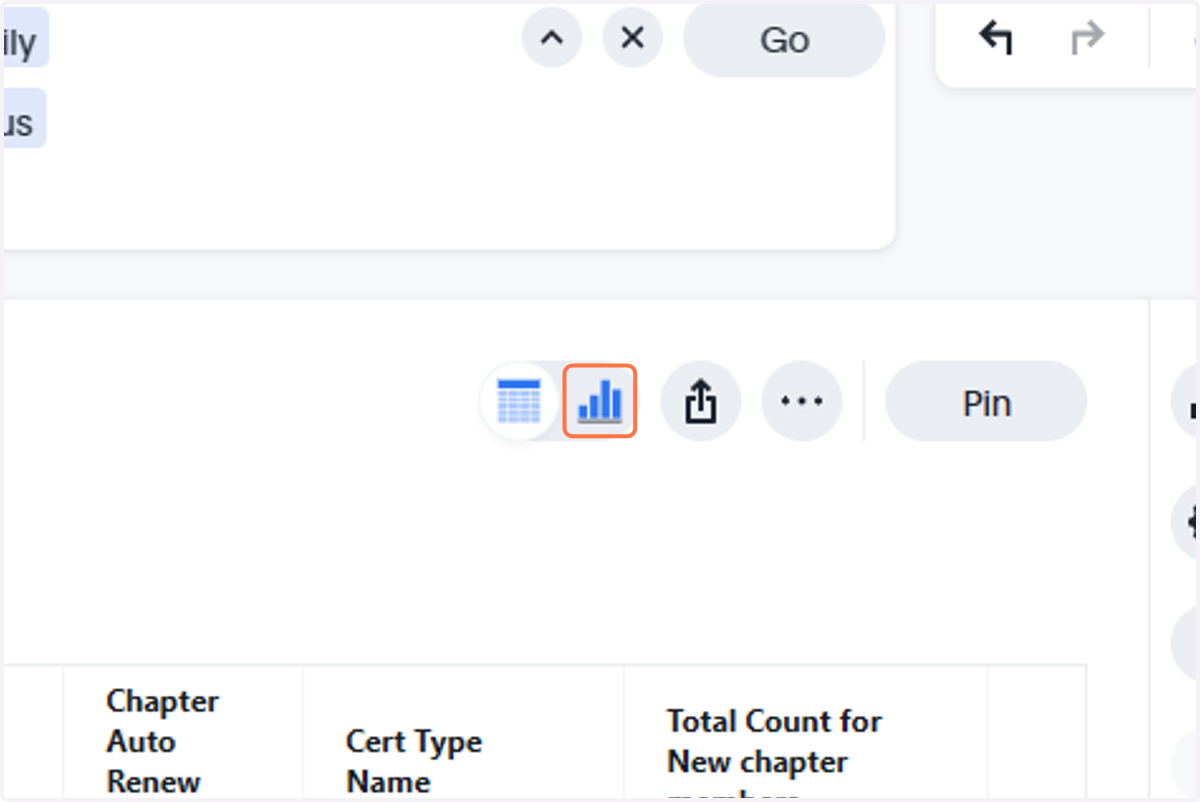
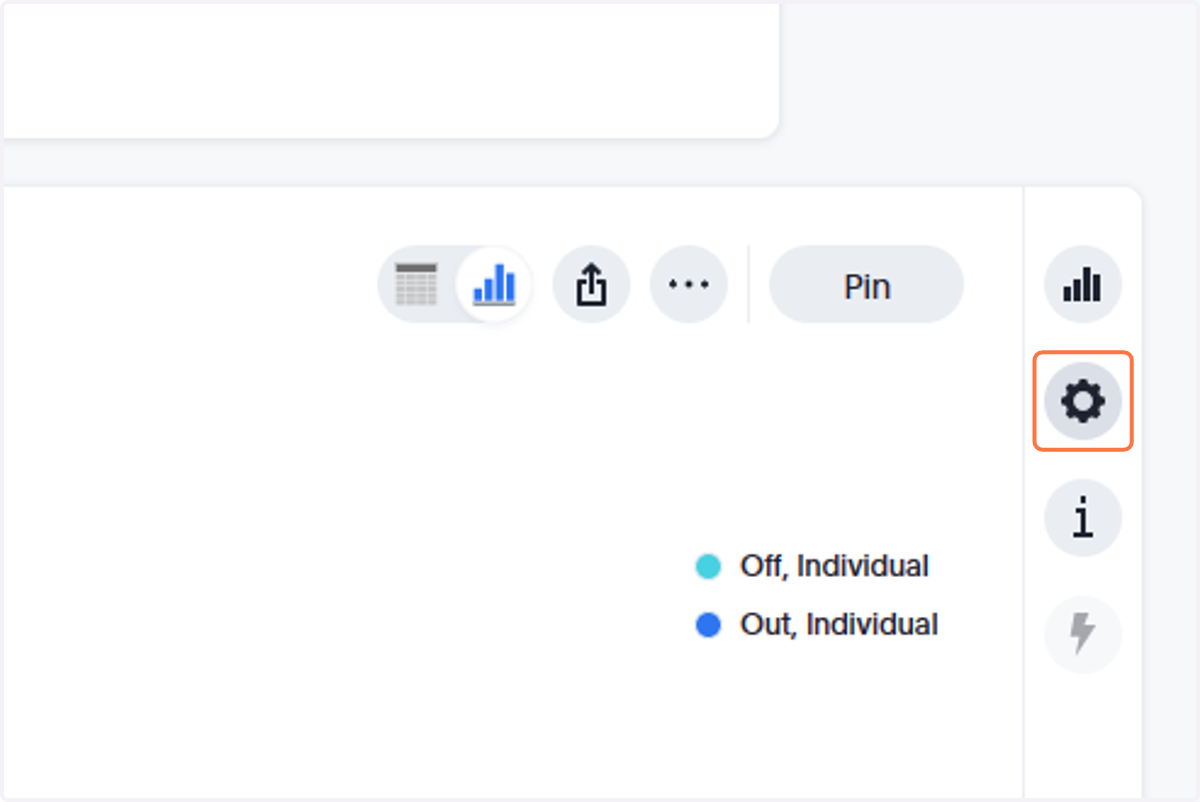
5. Click on the "settings" button
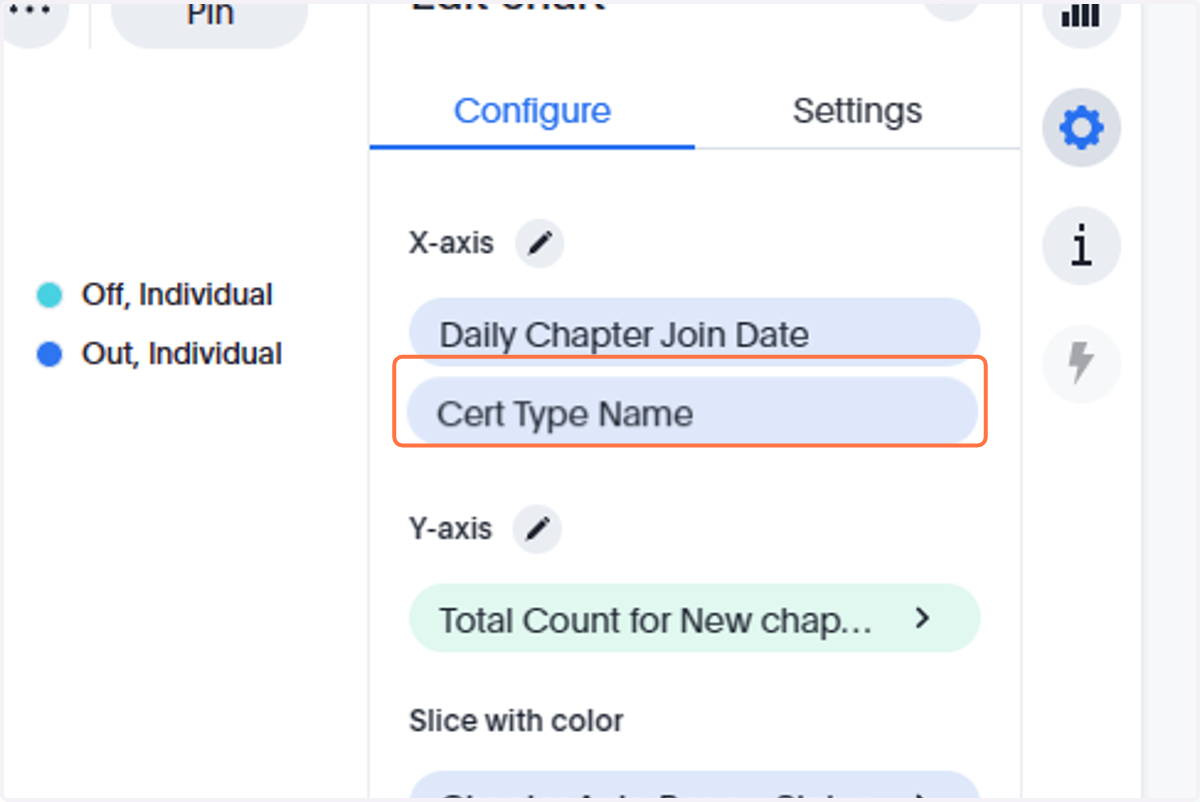
6. Drag cert type name from "not visualized" to the x-axis
This will add the cert types to your graph
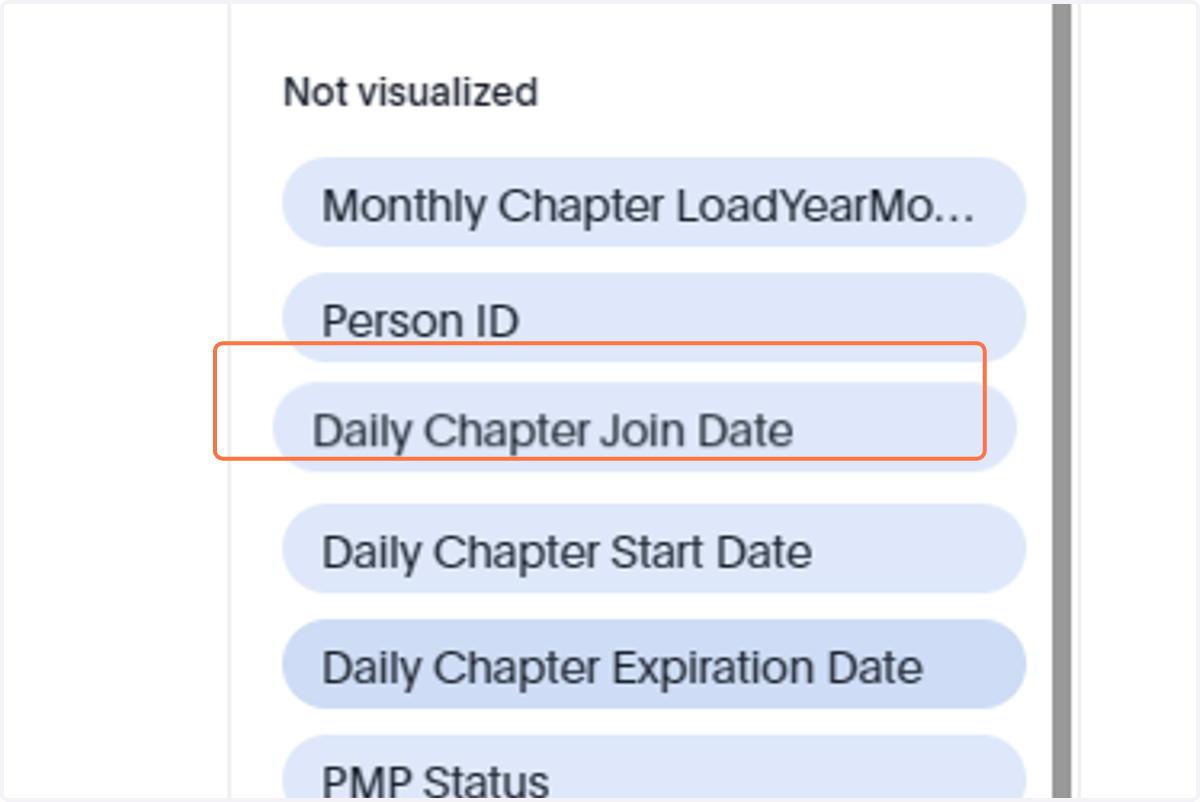
7. Drag Daily chapter Join Date from x-axis to "Not Visualized"
This is not required, although it is done in this tutorial to make the graph cleaner
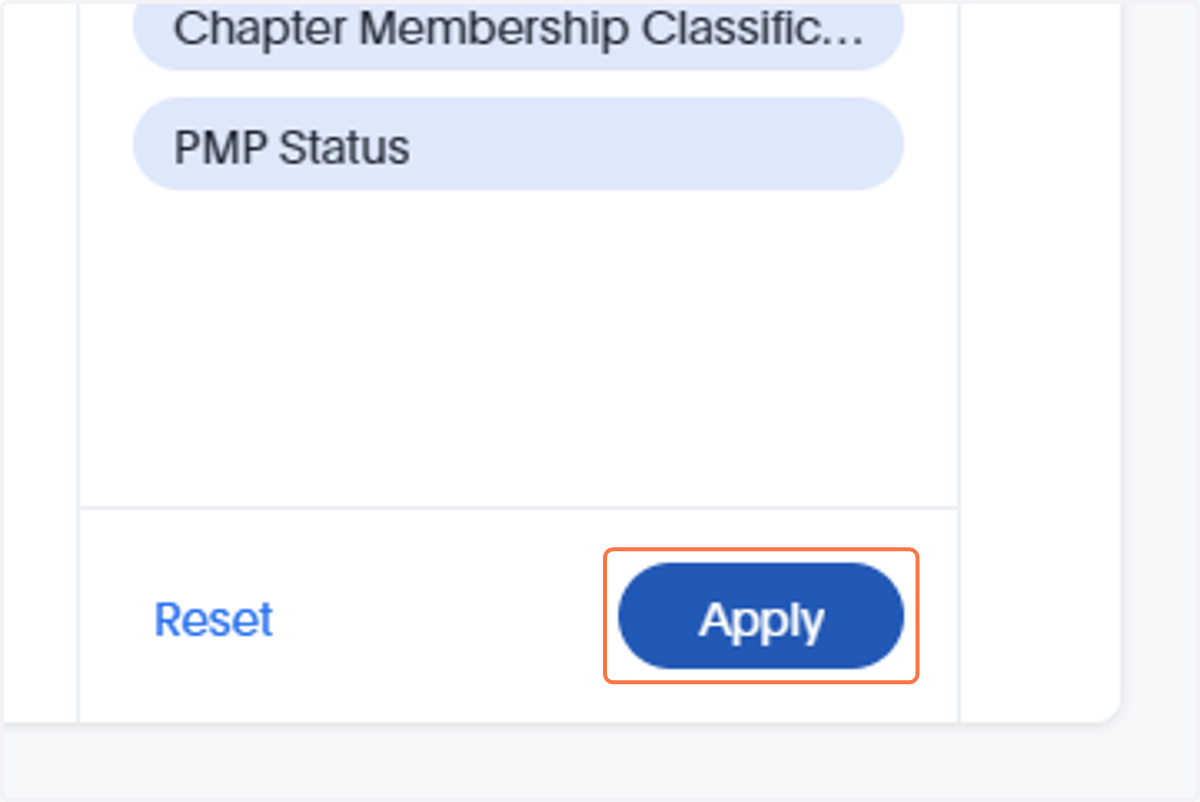
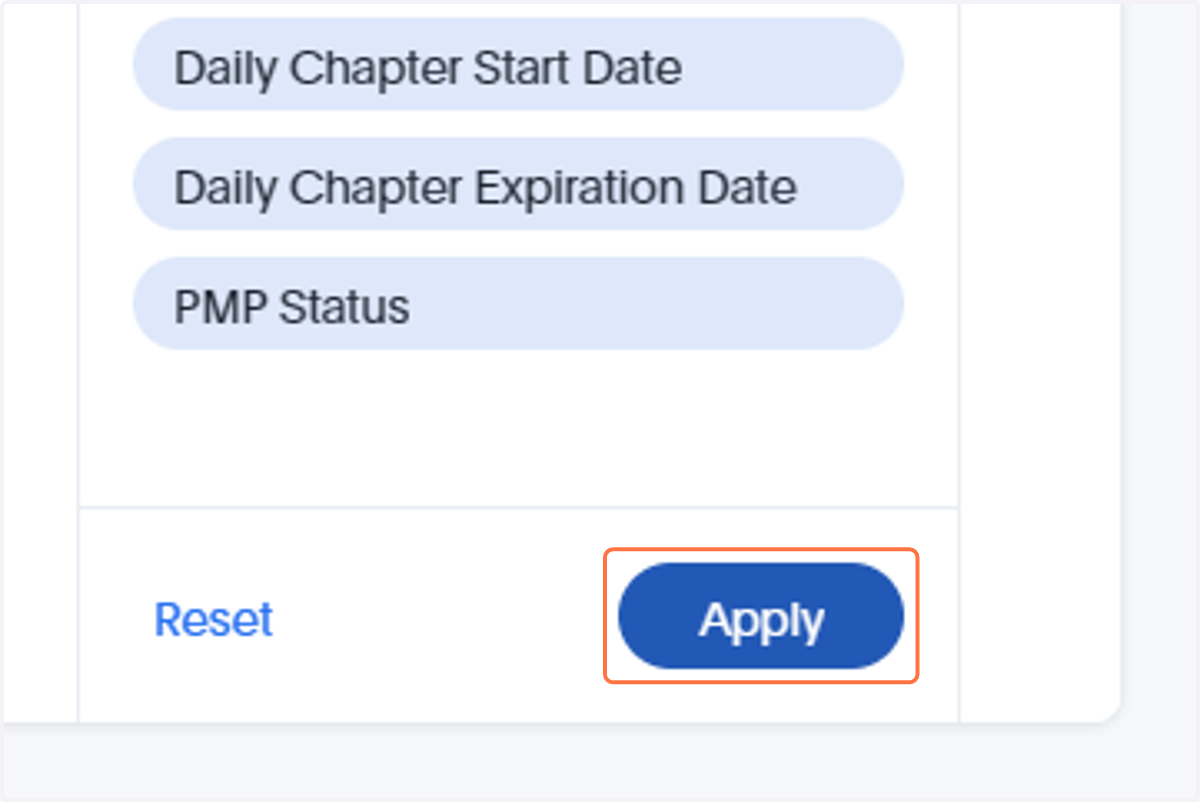
8. Click on Apply
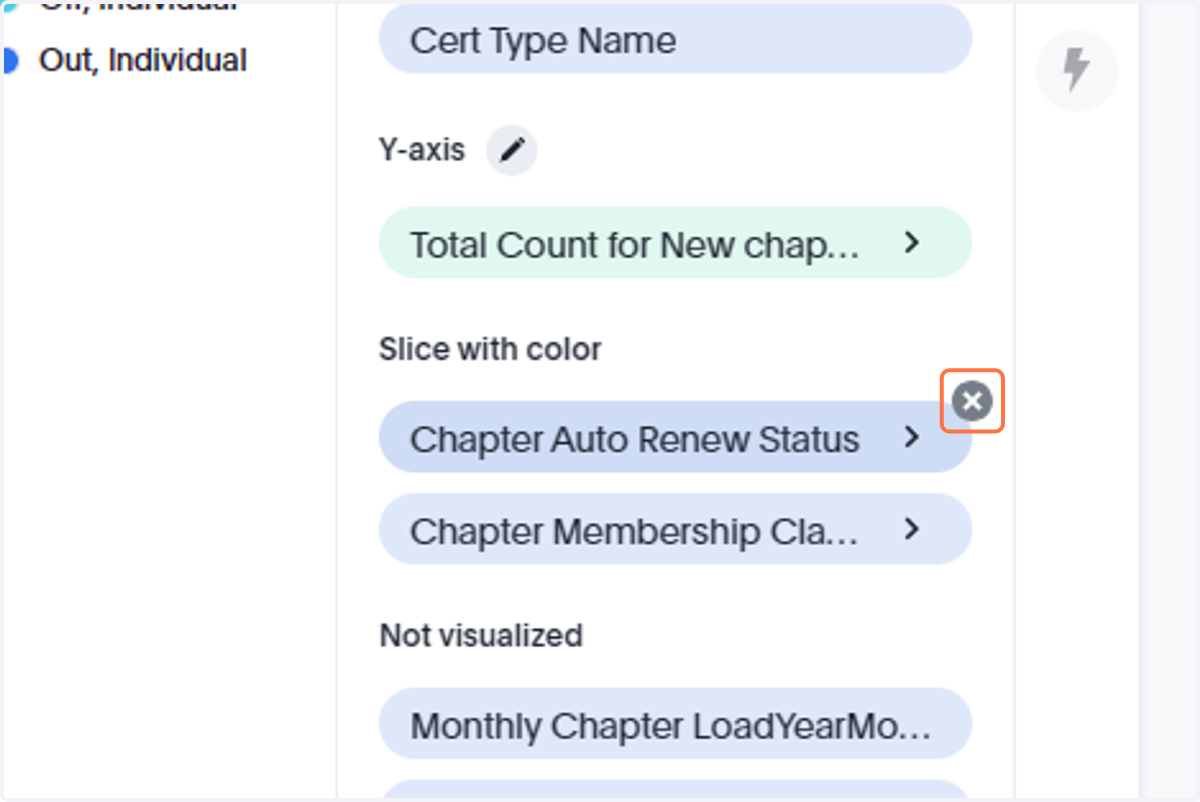
9. Click on "x" in top right corner of Chapter Auto Renew Status
This is not required, although it is done in this tutorial to make the graph cleaner
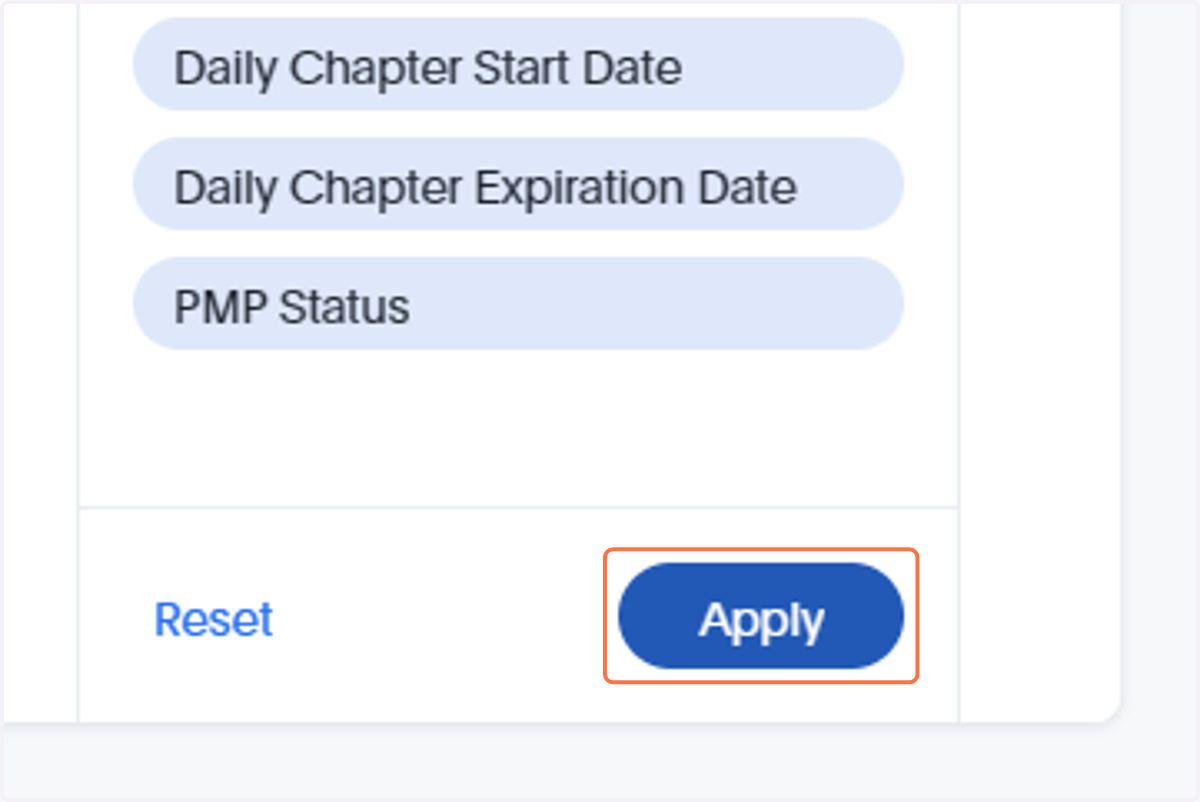
10. Click on Apply
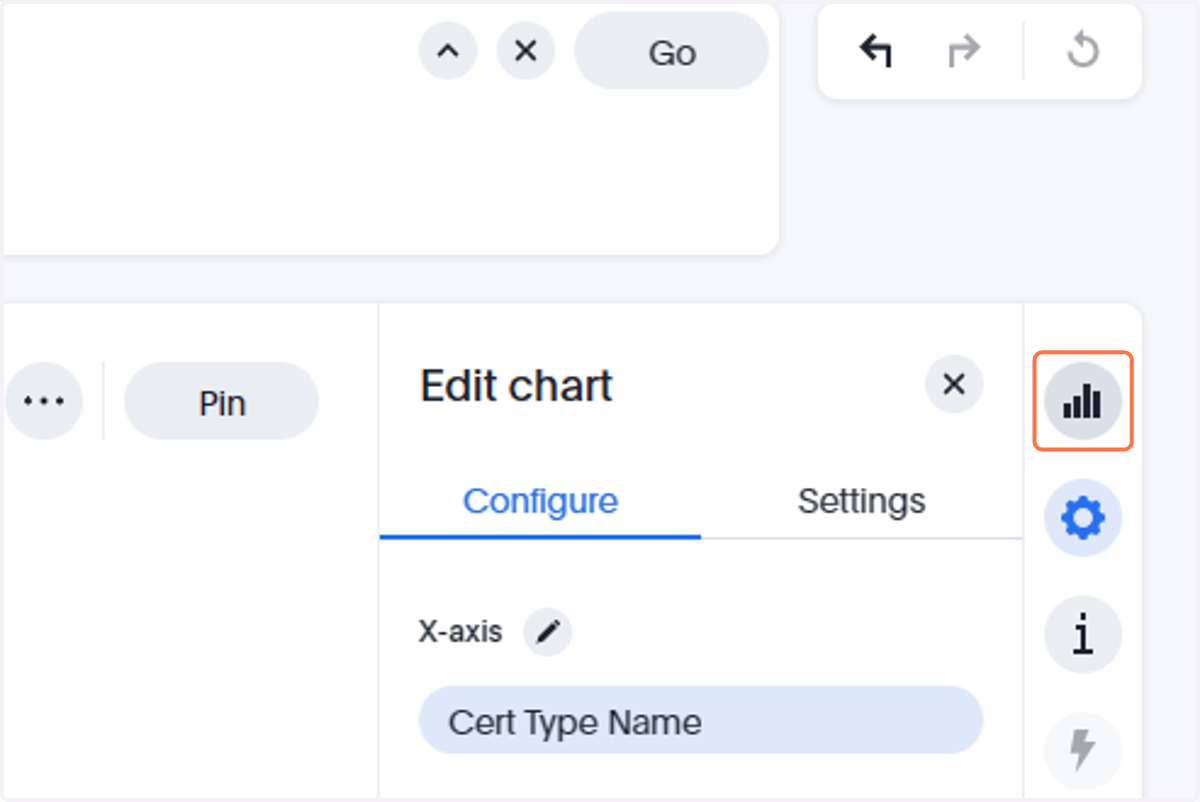
11. Click on graph button
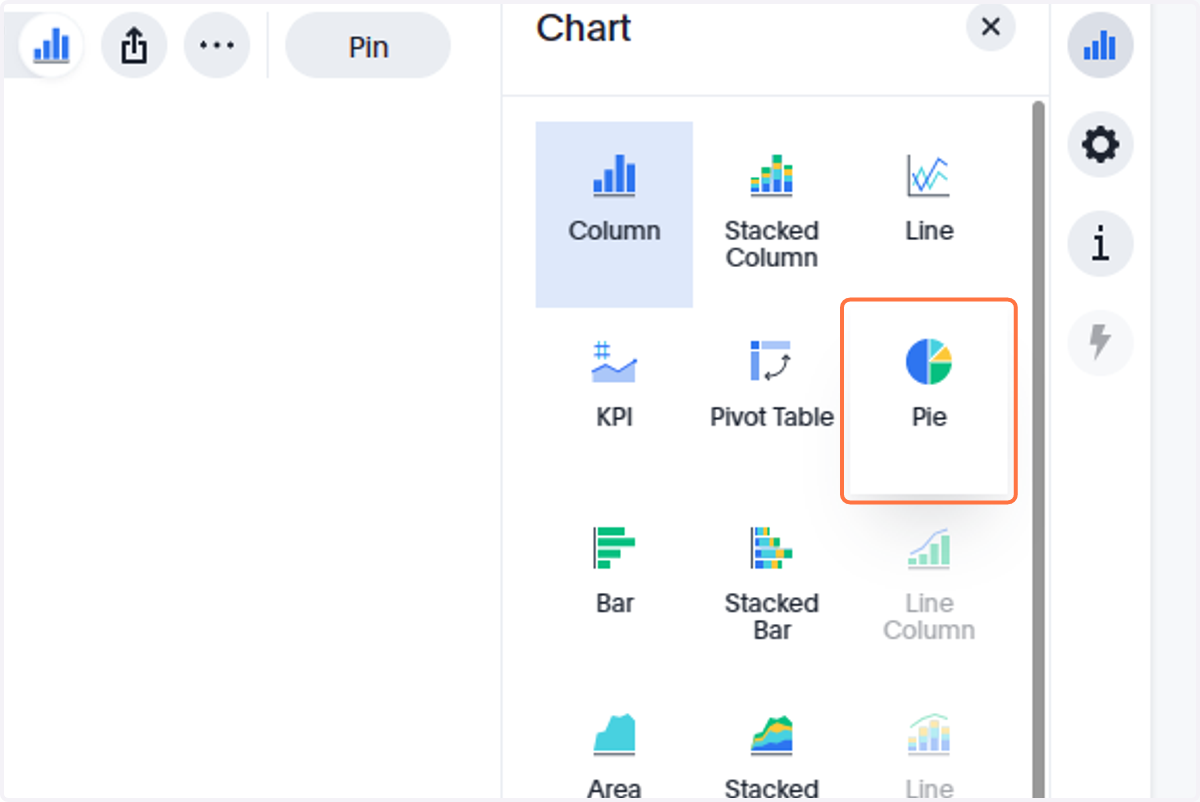
12. Click on Pie
This will switch your graph to a pie chart
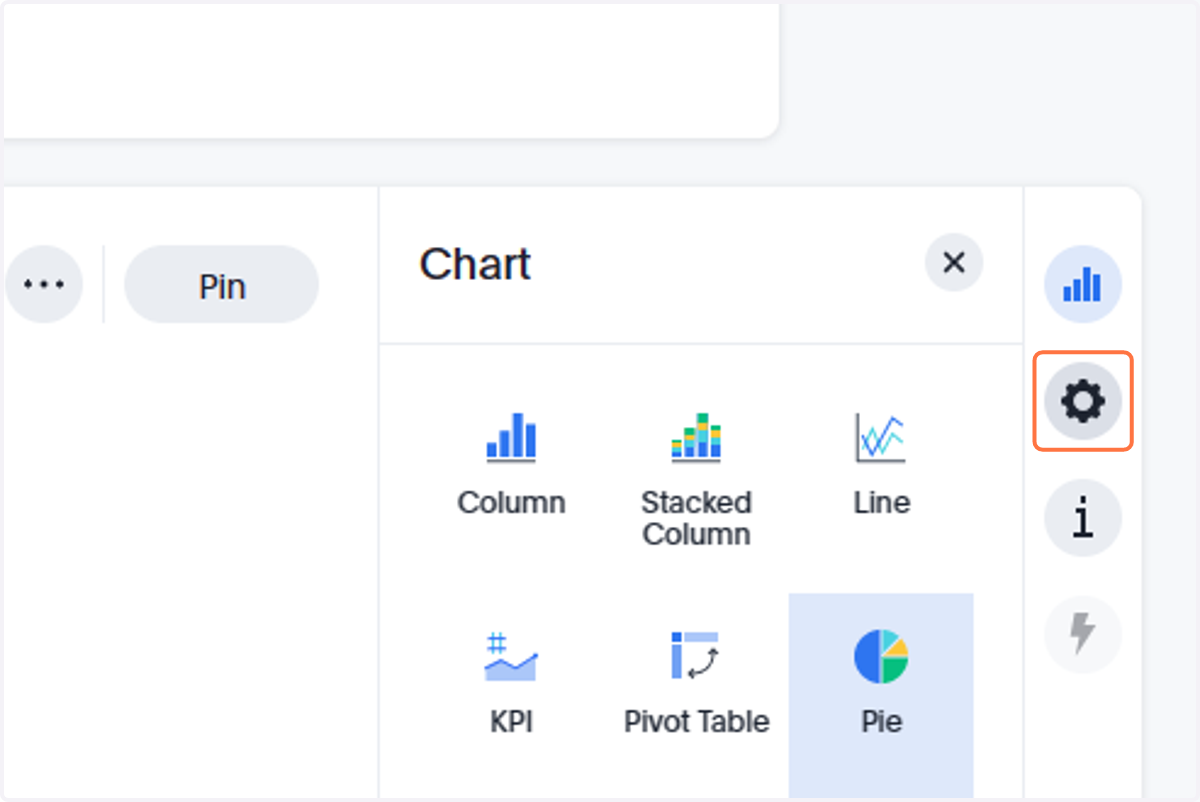
13. Click on settings button
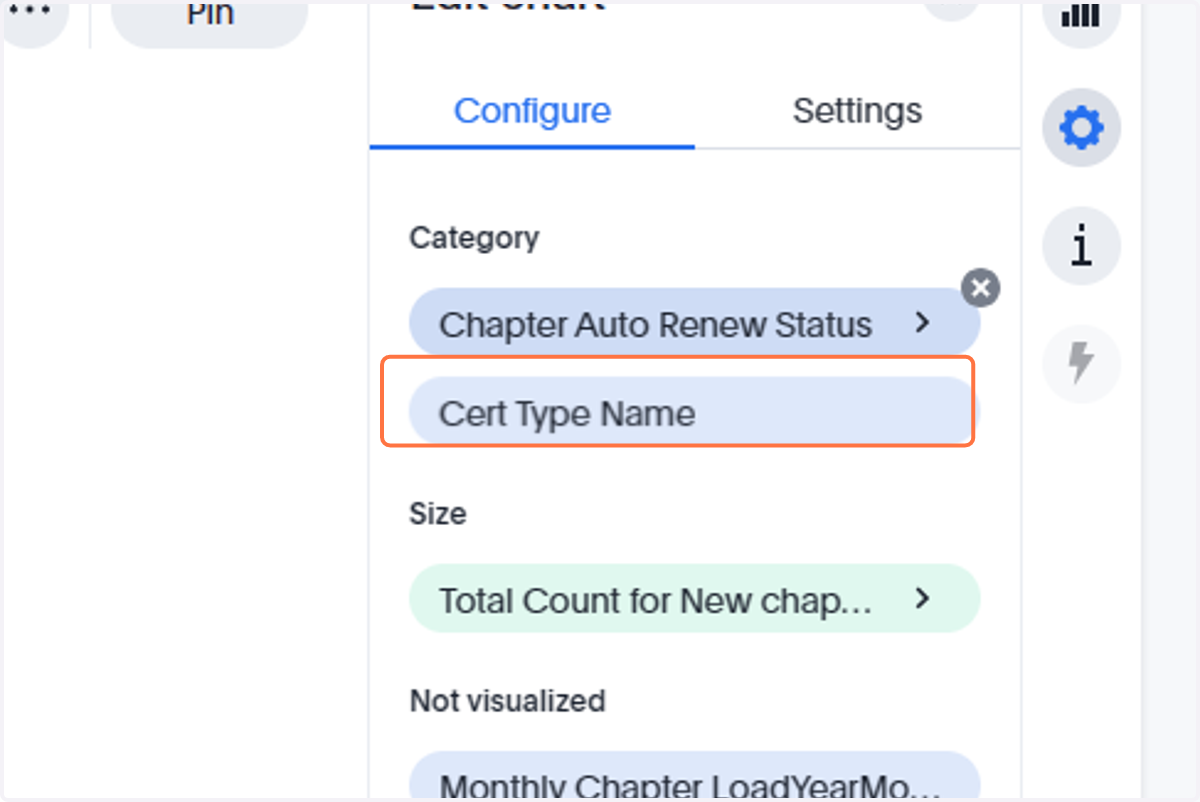
14. Drag Cert Type name to Category
This will visualize the certifications in the pie chart
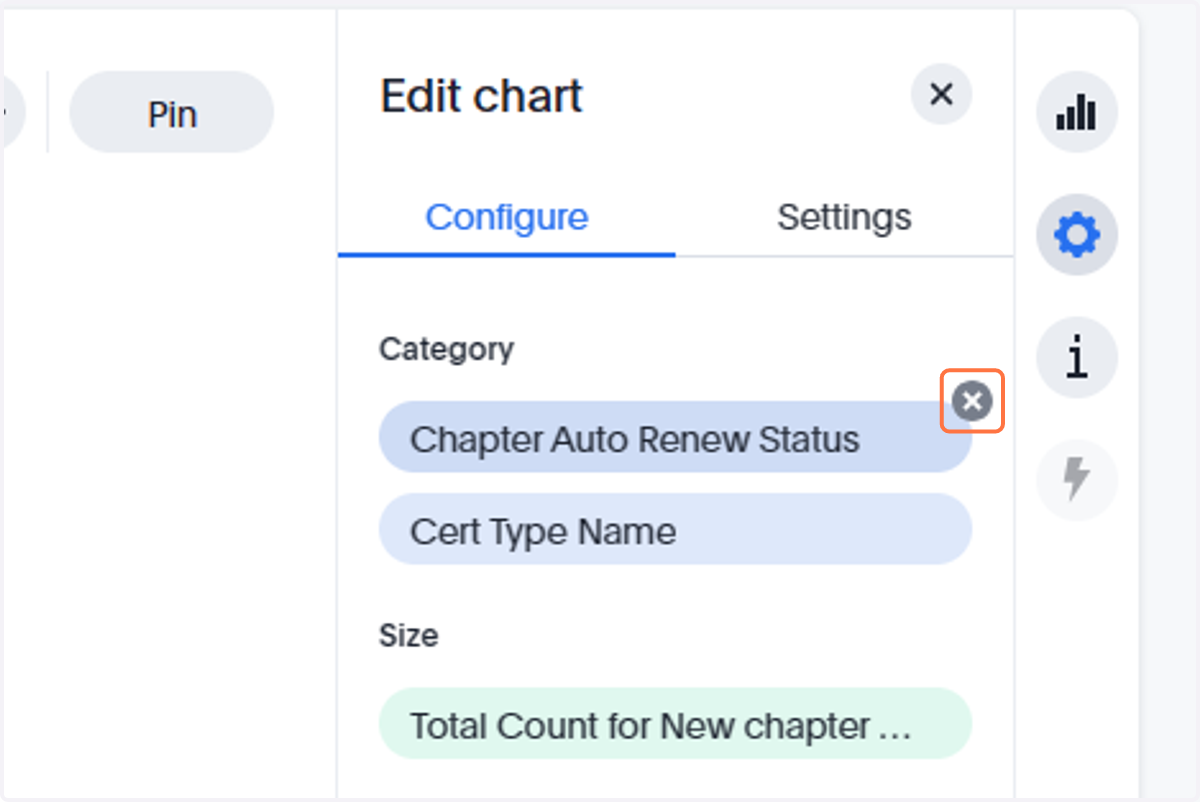
15. Click on x button for chapter auto renew status
This is not required, but is done in this tutorial to make the chart cleaner
16. Click on Apply
You should now see a pie chart of your members' certifcations.