Basic Analytics - Navigating Domo
This is a user guide to aid Basic Analytics clients in navigating Domo reporting as a replacement to Sigma reporting.
1. Log in to the Alleaves Platform
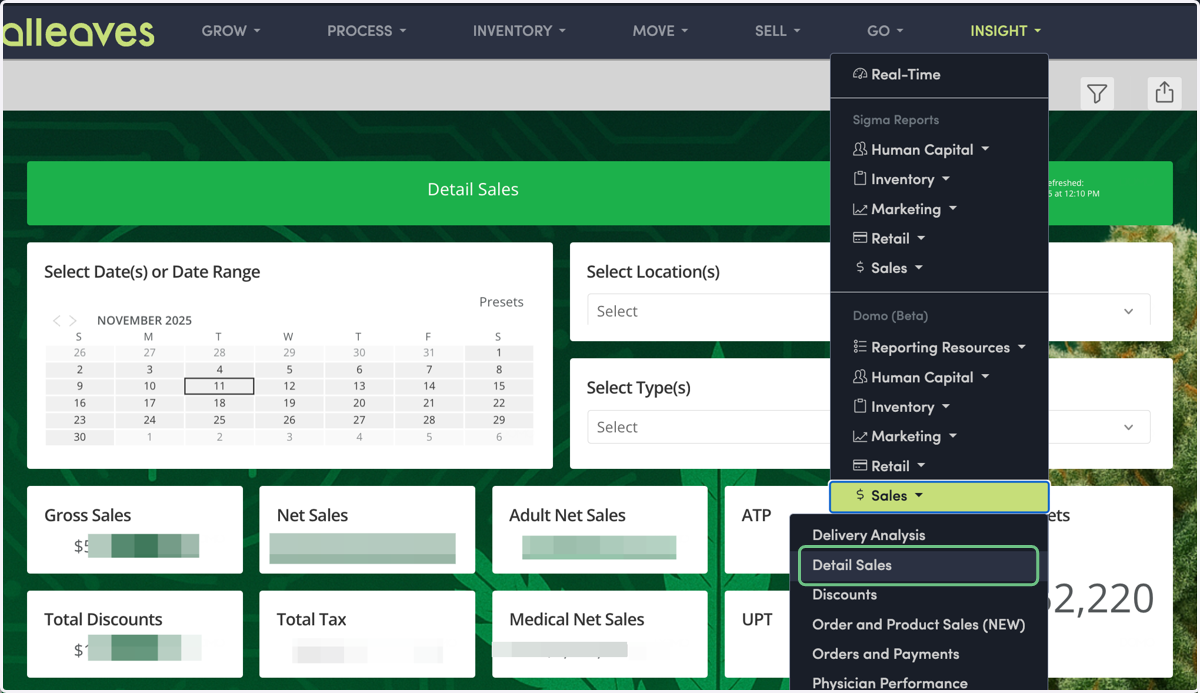
Access reporting by clicking on the "Insight" dropdown. Under the "Domo" section is where you'll find reports.
Most Domo versions of Sigma reports are in the same folder that they were in Sigma, unless otherwise specified below.
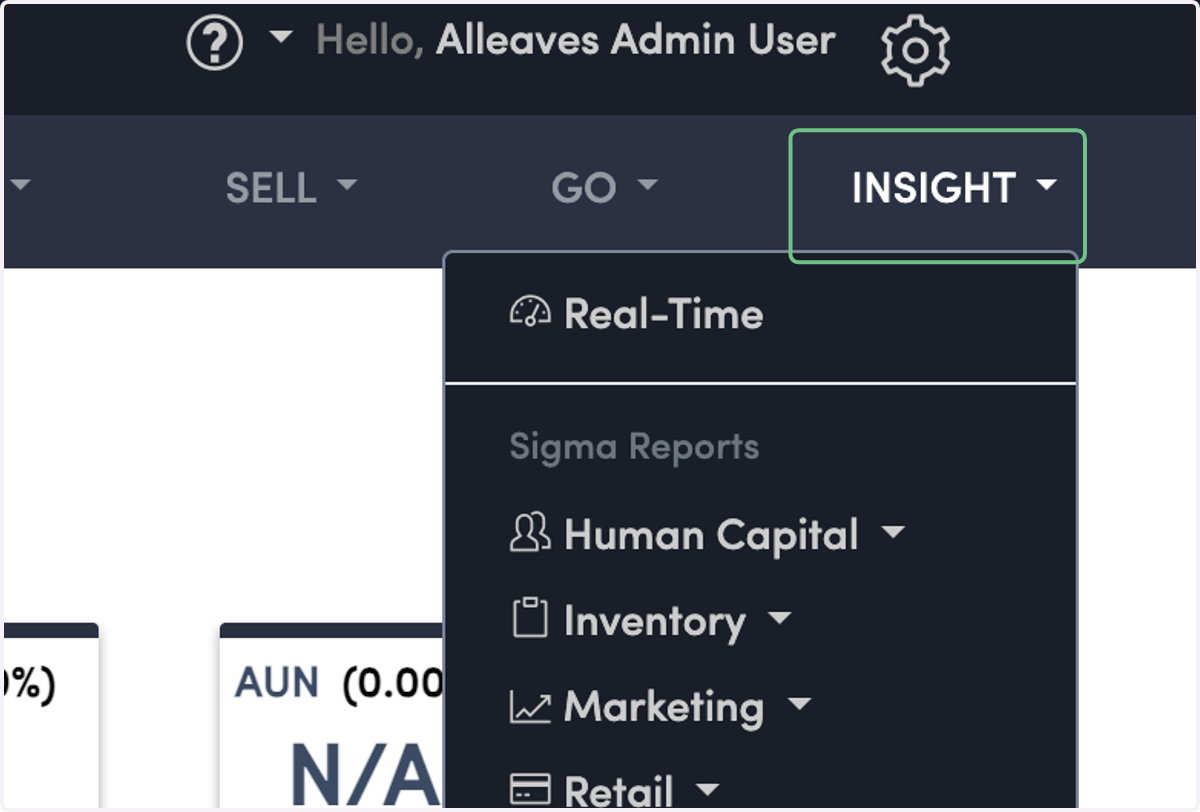
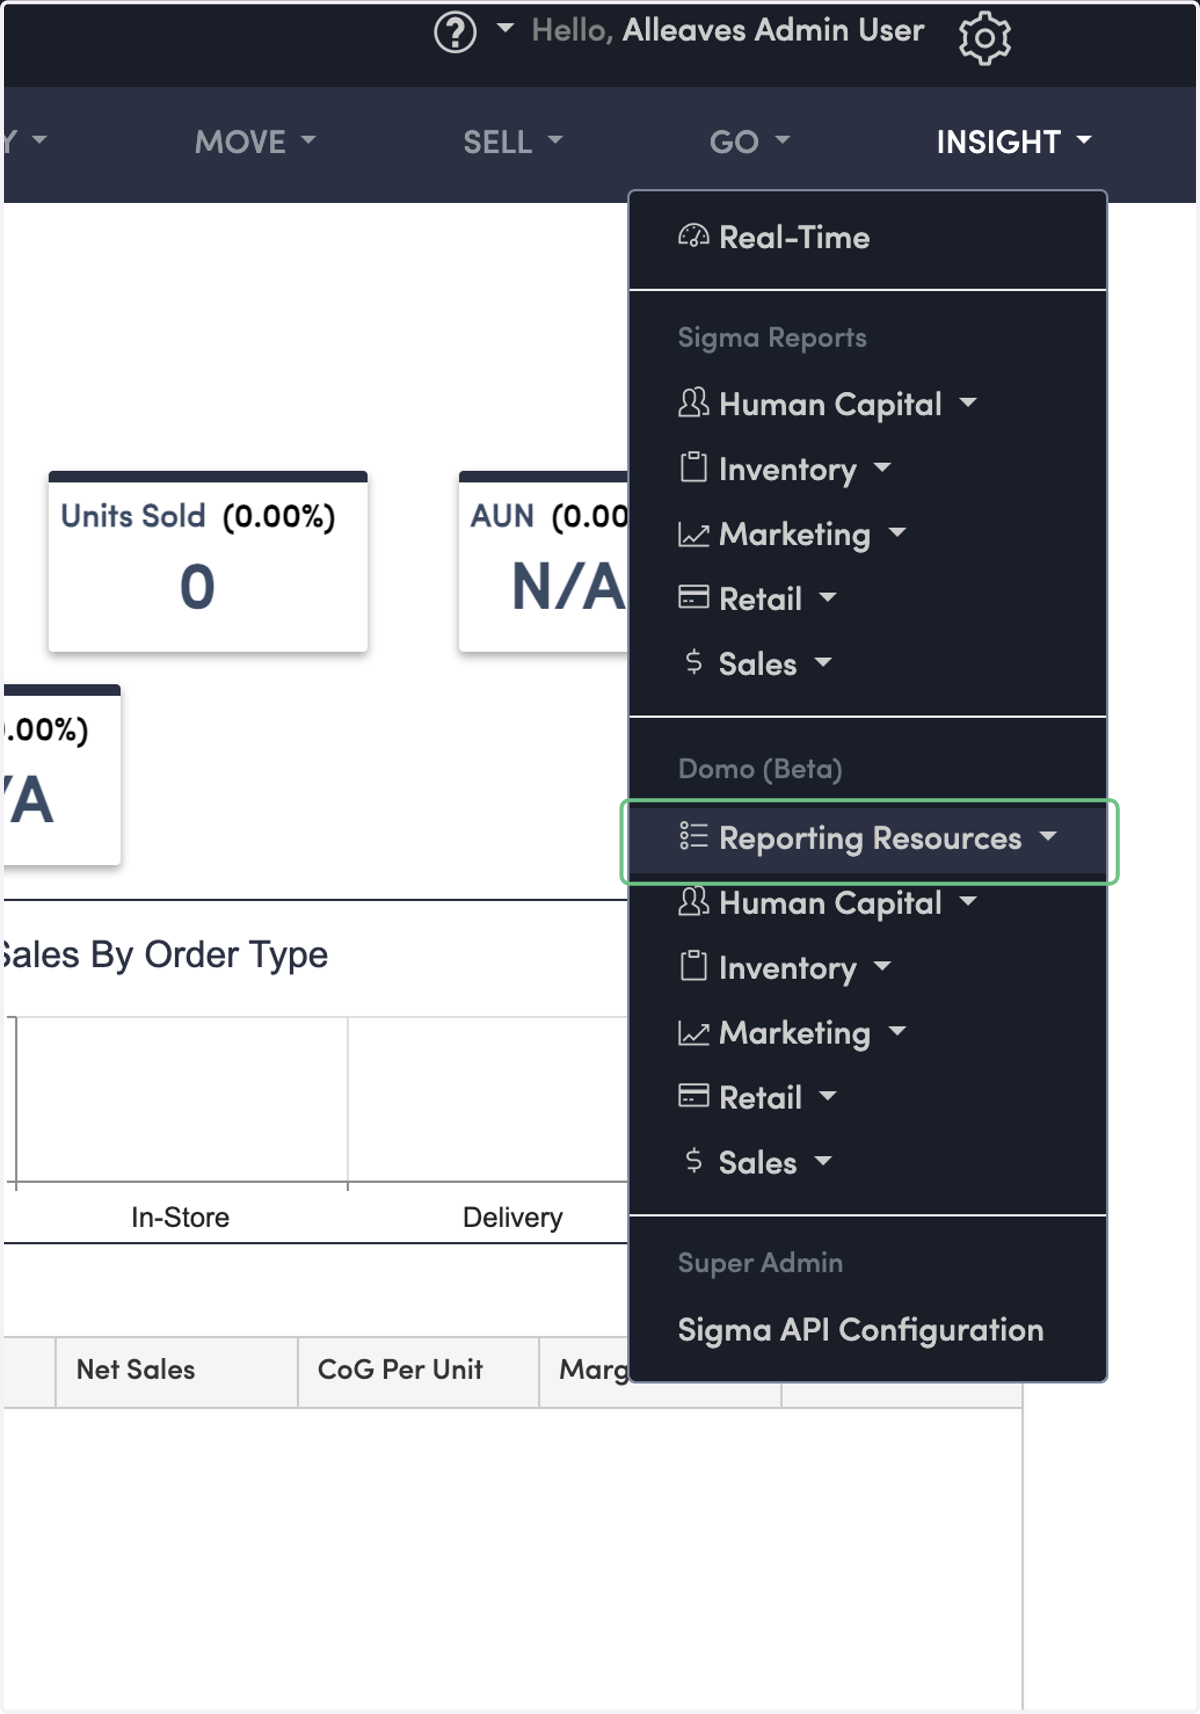
2. Click on "Reporting Resources"
This is where you'll find the reporting glossary (a dictionary of metrics used across reporting), the report name mapping document (to identify Domo reports related to Sigma reports), and the user guide (which hosts this Domo walkthrough).
In most cases, there is a Domo equivalent for each Sigma report. Please refer to the Report Name Mapping document to trace pre existing Sigma reports to the new Domo reports. For any reports that do not have a Sigma equivalent, they'll have (NEW) in the title.
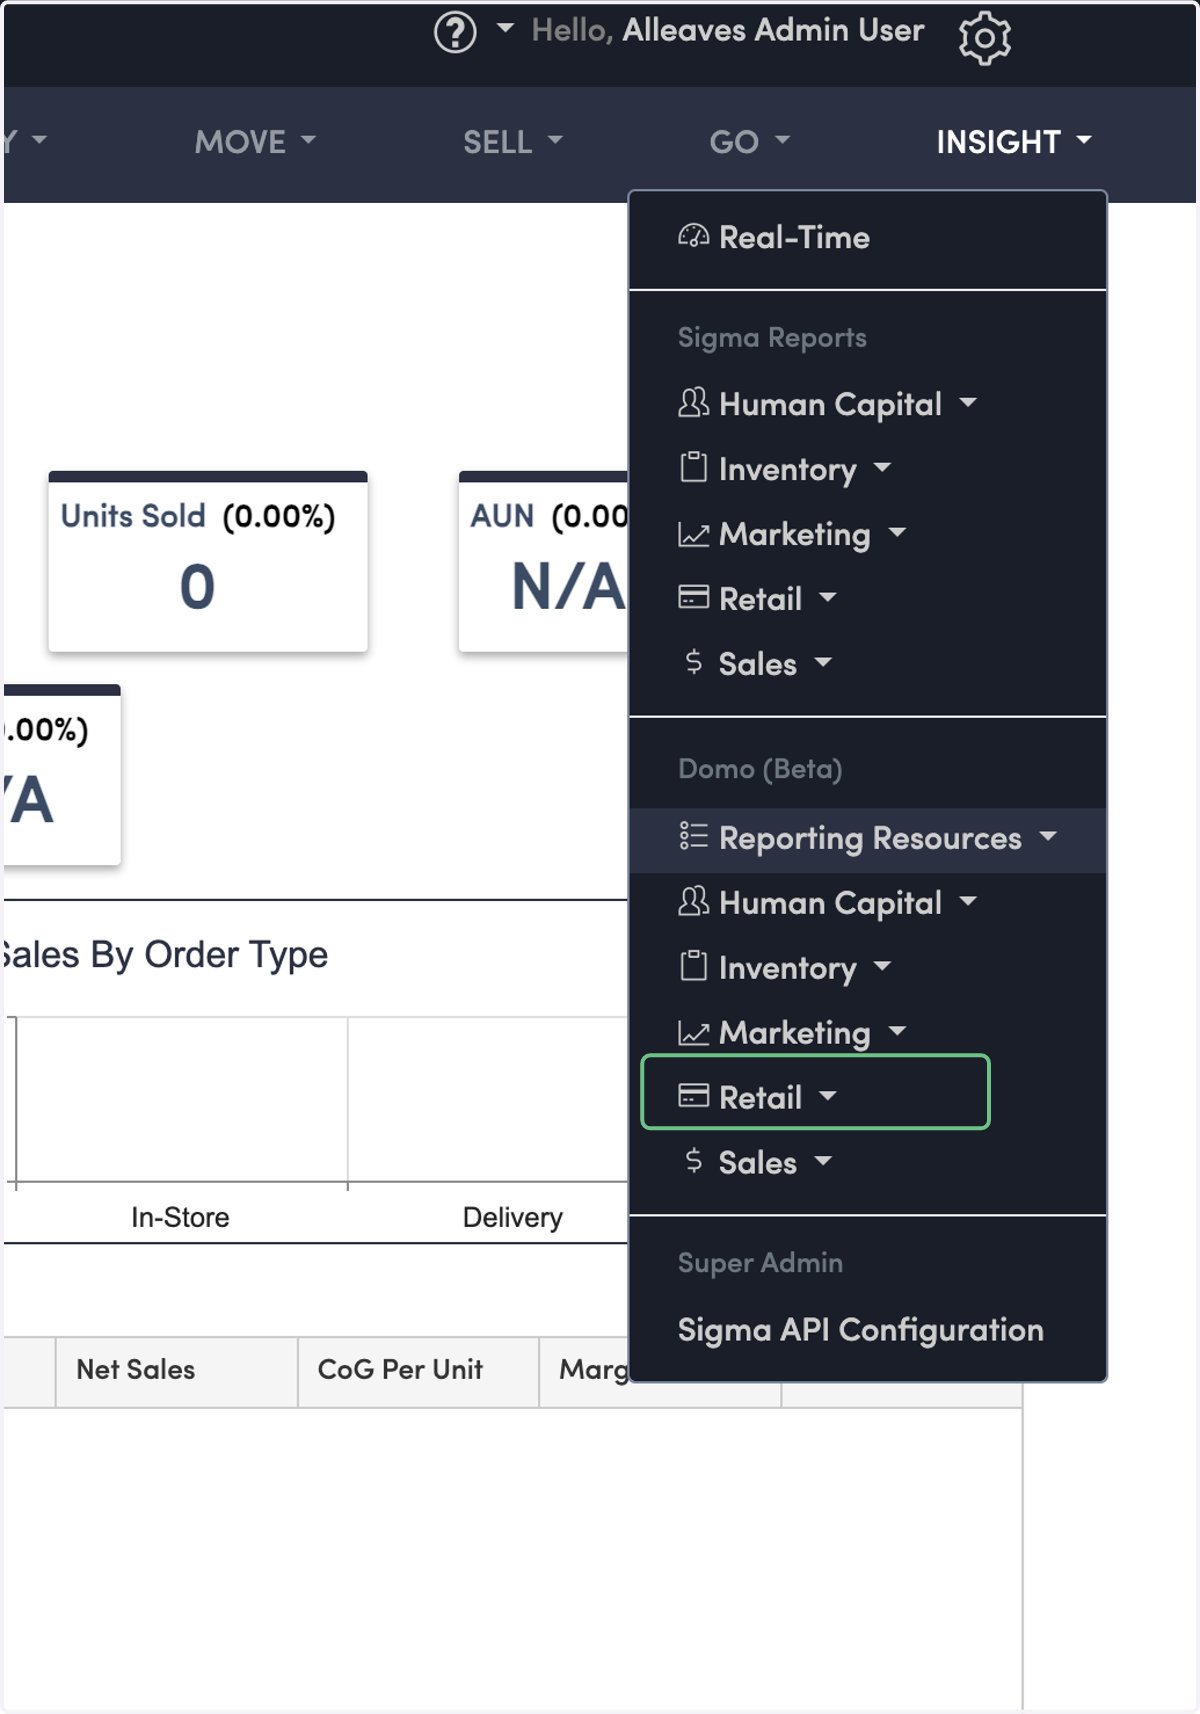
3. Click on "Retail"
This is where all retail reports are hosted. There is a Domo equivalent for every Sigma retail report with the exception of the ZOUT report which has been replaced by three separate "Closing" reports.
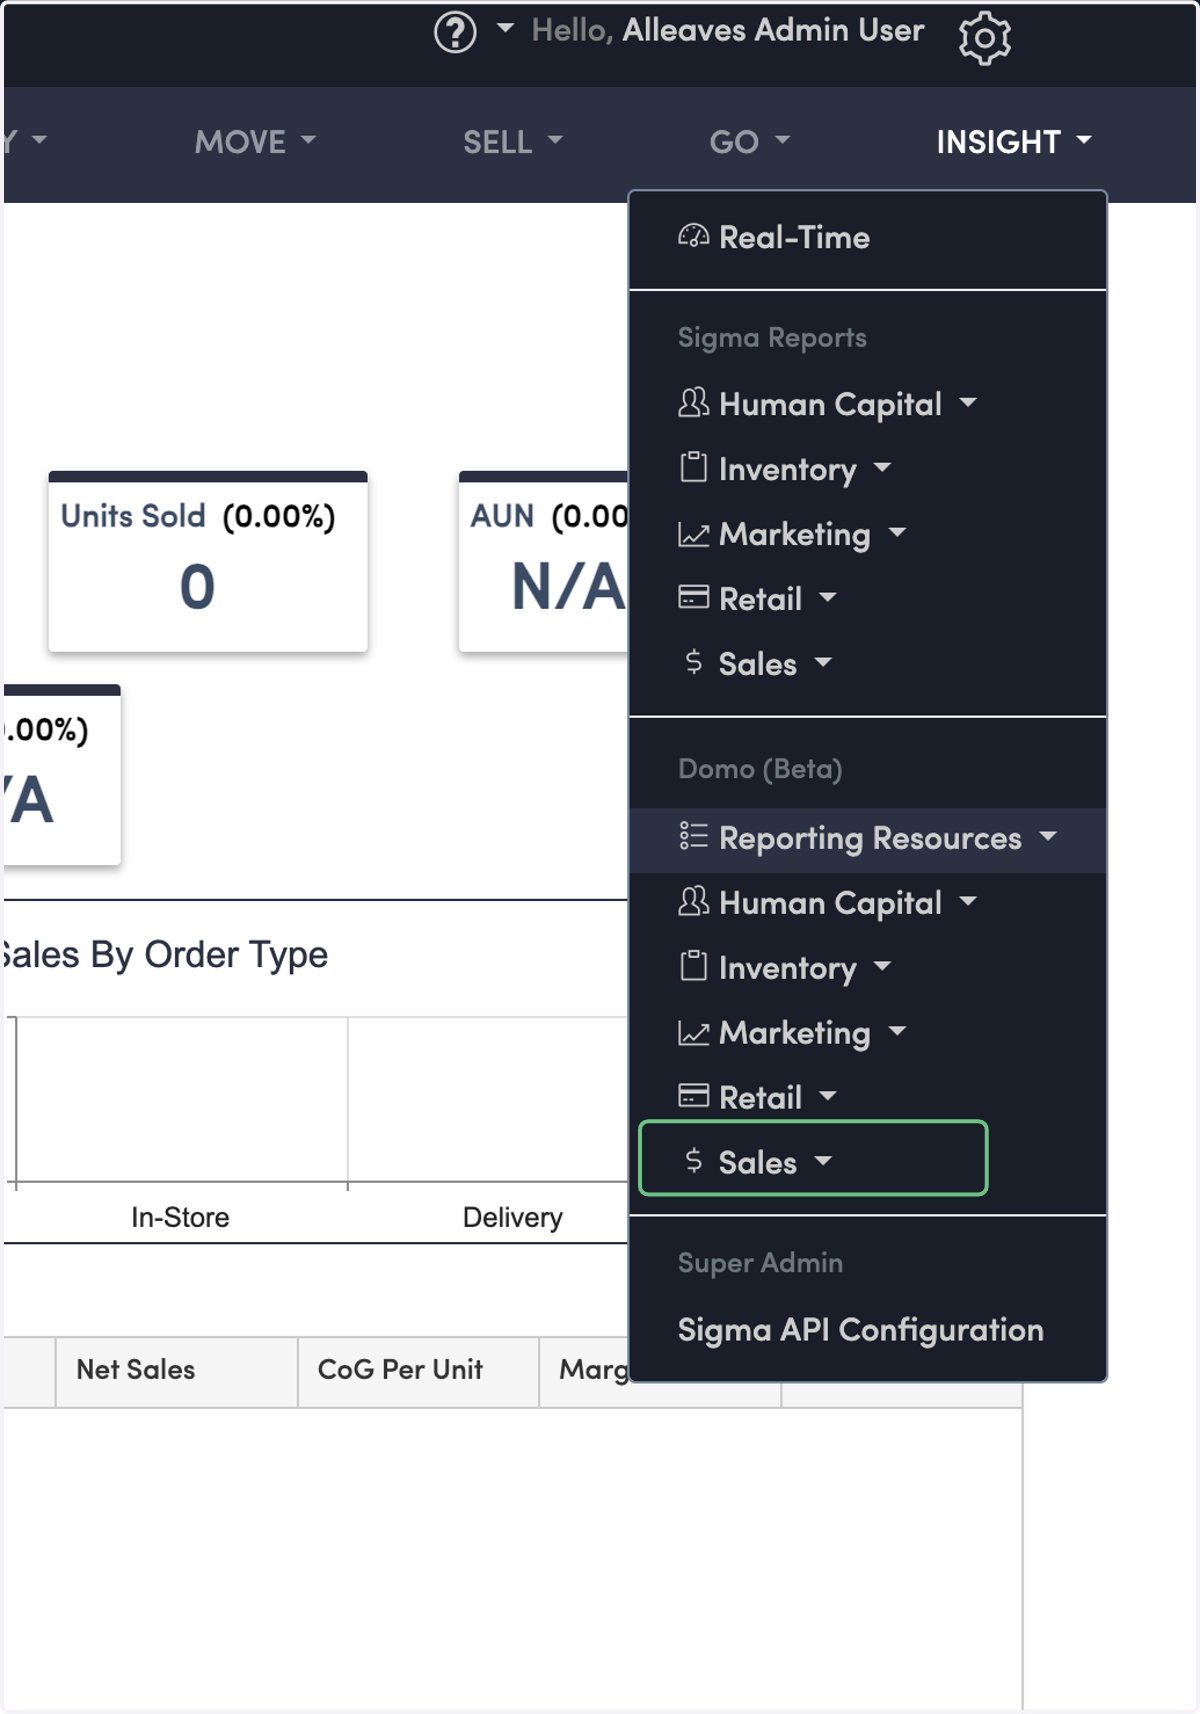
4. Click on "Sales"
This is where all sales reports are hosted. There is a Domo equivalent for every Sigma marketing report, with the exception of "Discount Analysis".
Sigma's Discount Analysis report has been replaced by Price Adjustment reports. This is in the Domo's Sales - Price Adjustments folder. There is a report in this folder for each type of price adjustment (discounts, donations, loyalty, etc.)
Alleaves > Insight > Domo > Sales > Detail Sales
This is the report used in this example.
5. Detail Sales Report
From the "Insight" menu, navigate to the "Detail Sales" report via the "Sales" folder
6. Detail Sales Report
You'll notice the report title and the last refresh datetime to the right of it.
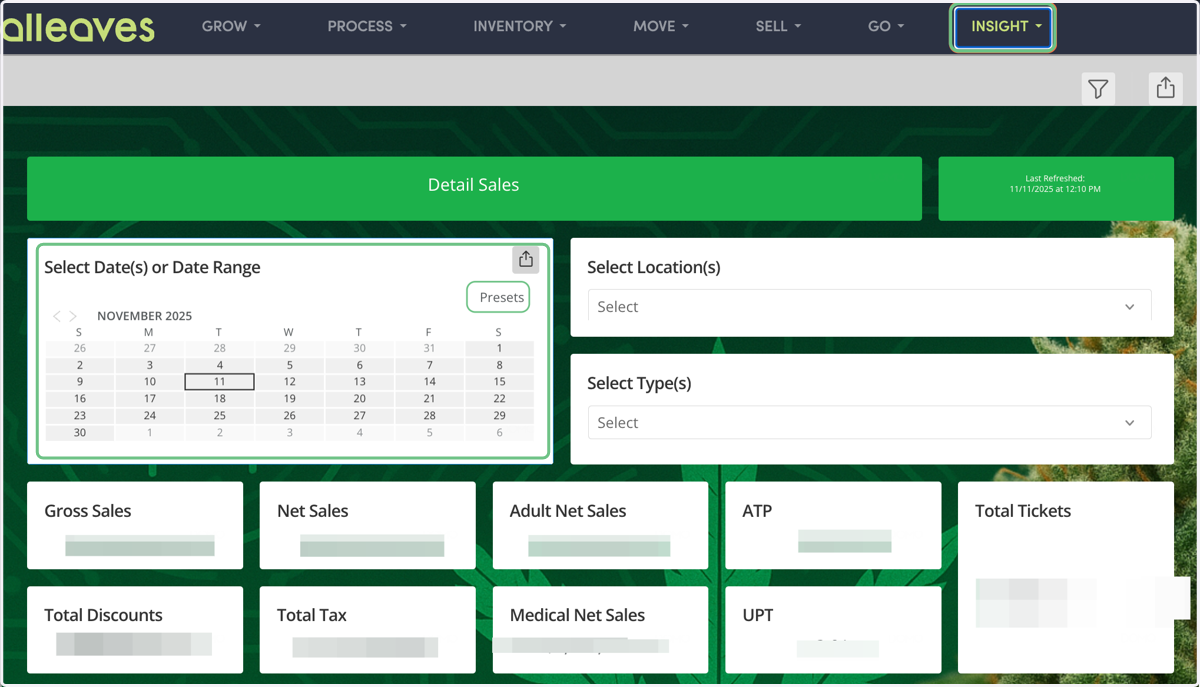
Date Selector Filter Cards
The options chosen within the Date Selector filter card flow through to all of the other cards in the dashboard.
7. Modifying Date Filter
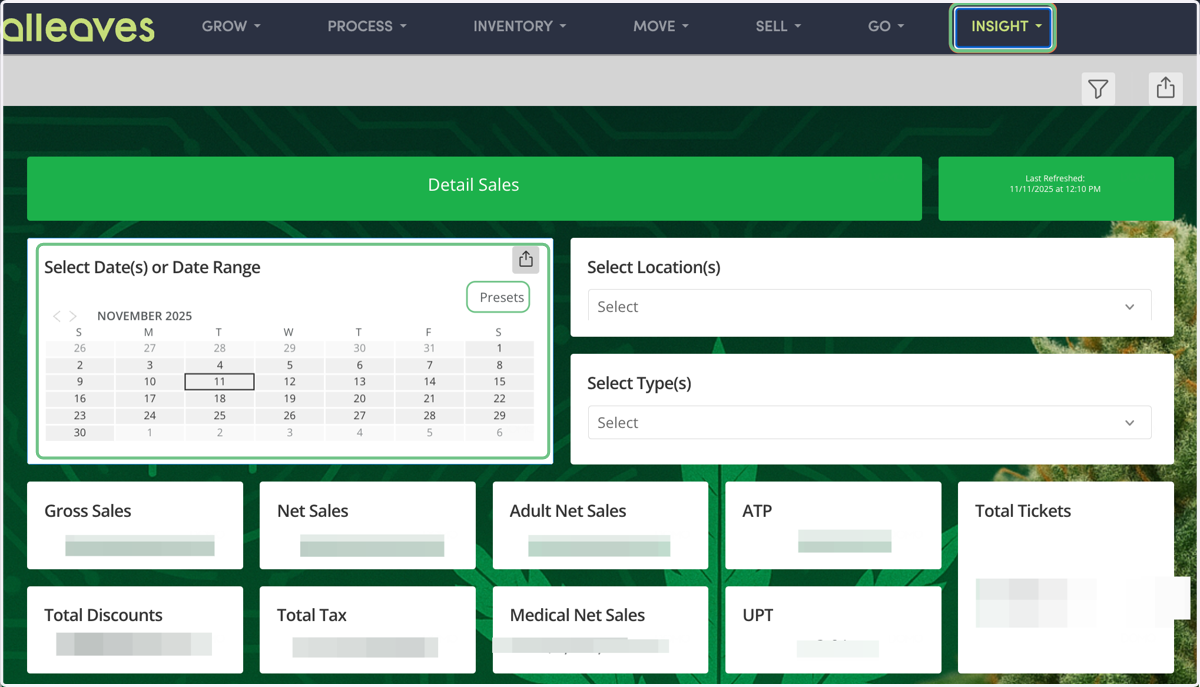
The date selector filters all cards on the dashboard. You can either click around in the date selector card to filter data to a specific day or date range OR you can click presets in the top right corner.
8. Modifying date filter
Selecting a single date
Click on the date you'd like the dashboard to show data for.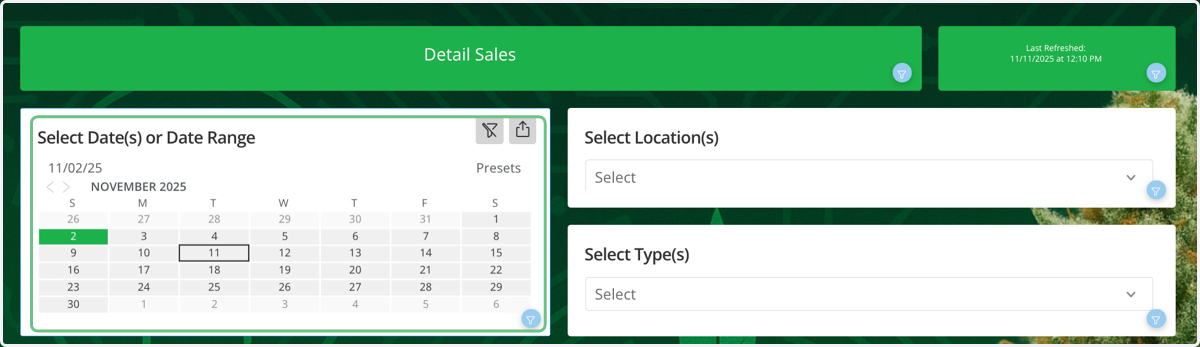
9. Modifying date filter
Selecting a date range
Click on the beginning and end date for the date range you'd like the dashboard to show data for.
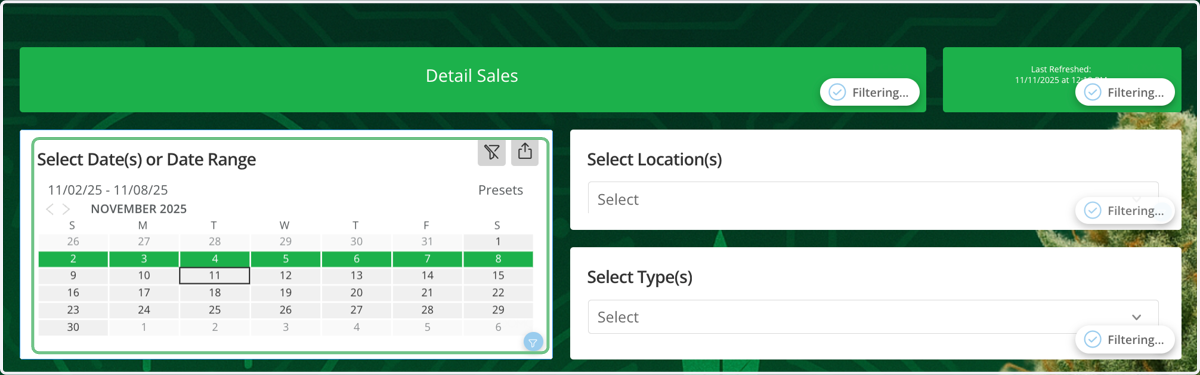
10. Modifying date filter
Selecting a date range across months
To select a date range across months, click the start date of the custom period, click the <> arrows to change the month, and hold down CTRL (or command for Mac users) at the same time as clicking the end date of the custom period.
You can see the date range below reflects the selected dates.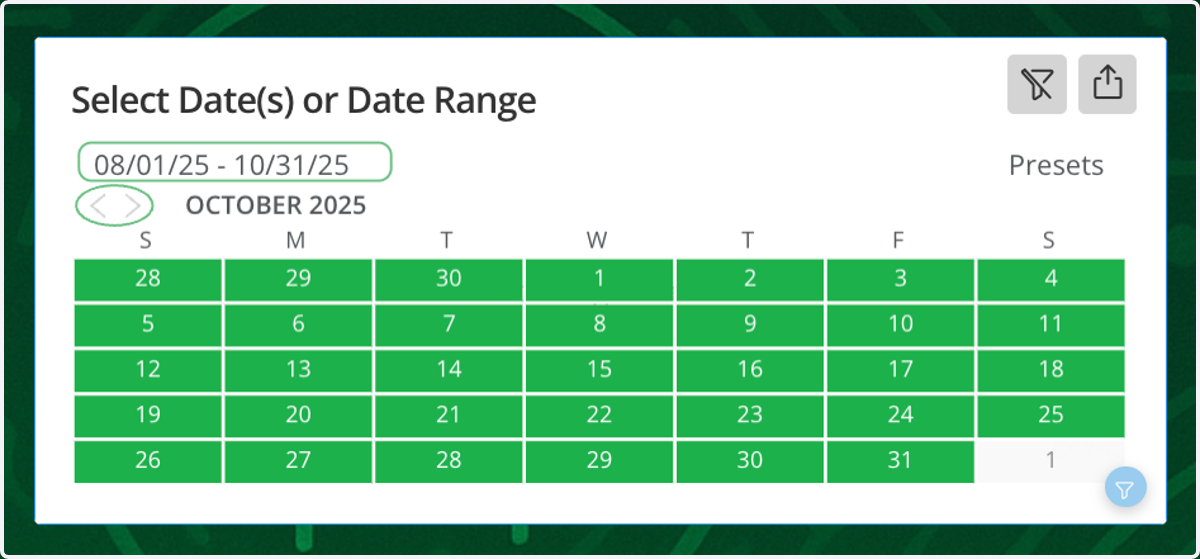
11. Date Selector Presets
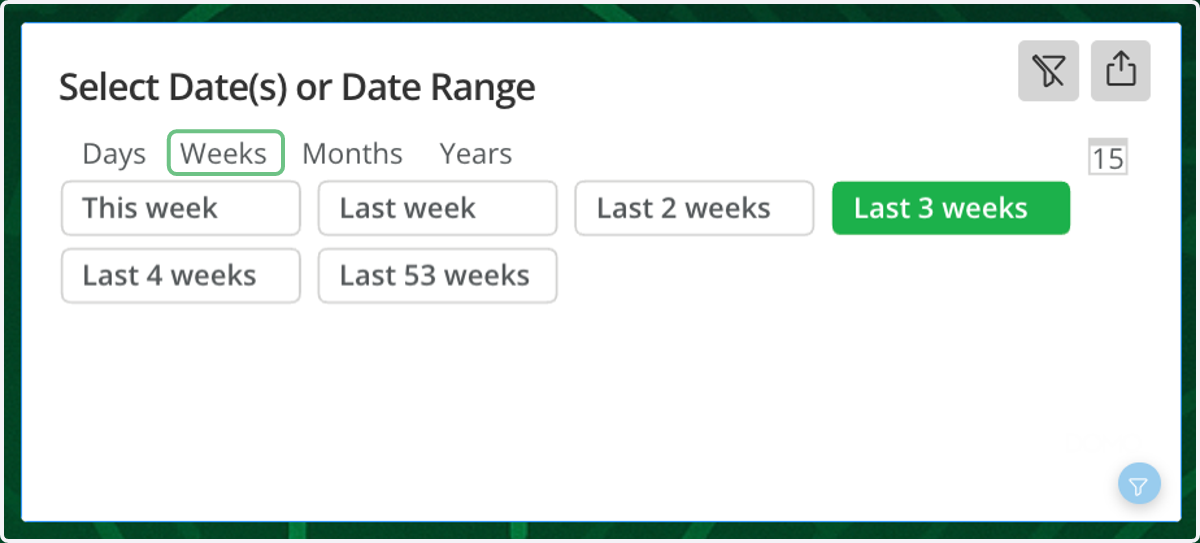
These are the date selector presets. They allow for rolling preset date ranges to be applied to the dashboard.
There are options for days, weeks, months, and years (where applicable). The default is shown in days.
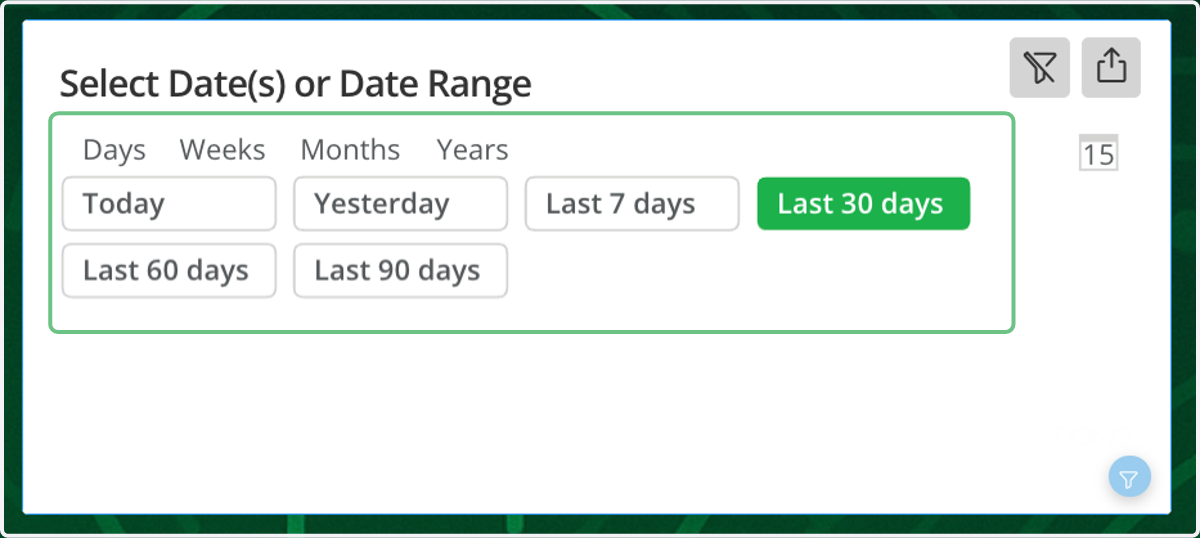
12. Date Selector Presets
Here, we click from the presets selection --> weeks --> last 3 weeks.
13. Date Selector Presets
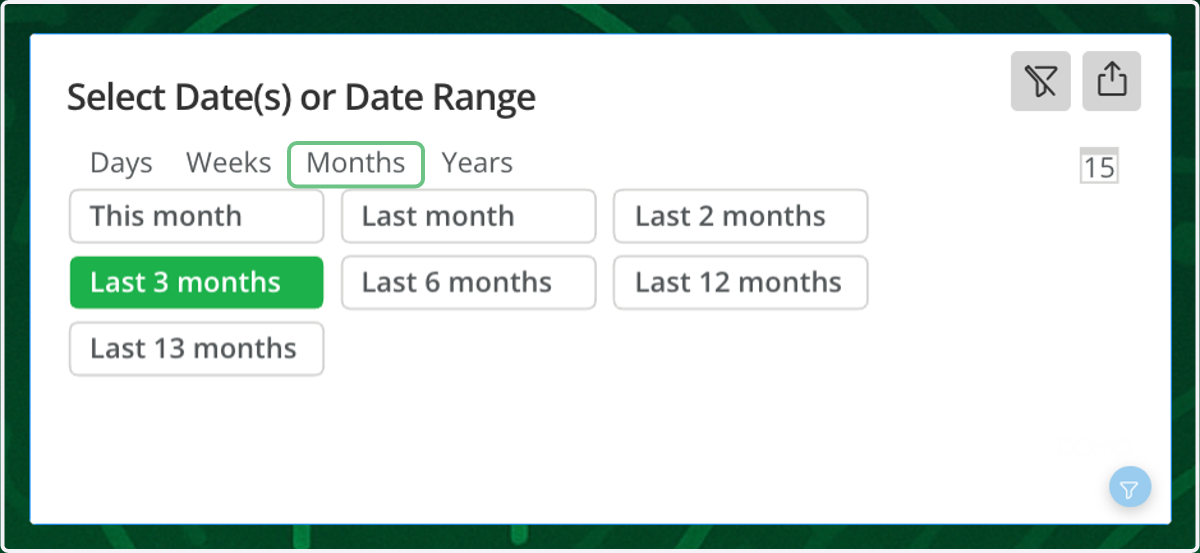
Here, we click from the presets selection --> months --> last 3 months.
14. Date Selector Settings
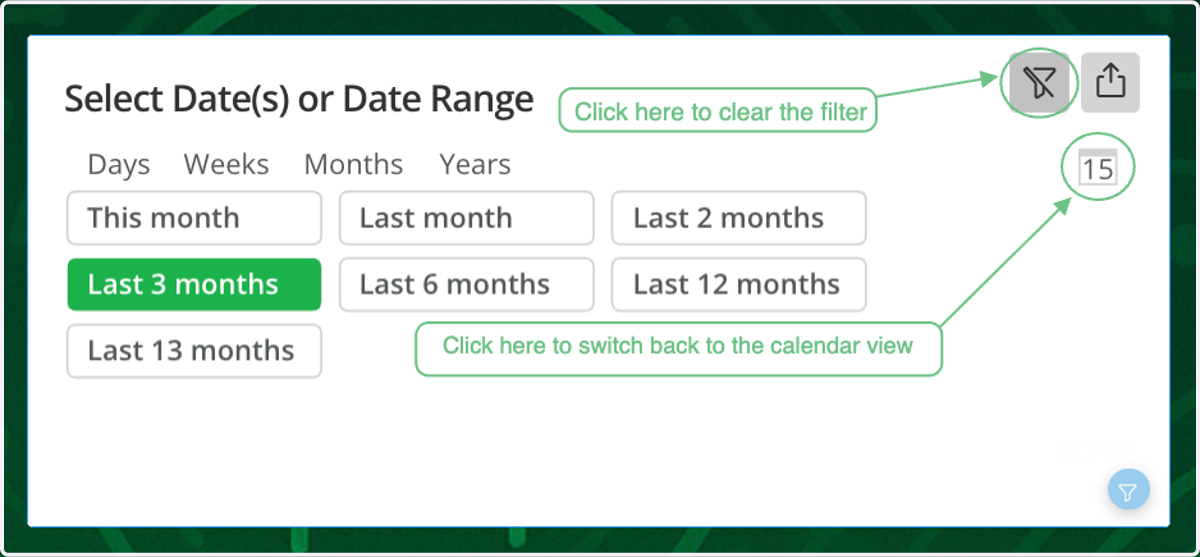
There are many ways to clear filters. One way is to click this button which will only clear the filter for that specific card/field. You can also choose another option and it will write over the previous option chosen.
You can click the calendar icon to switch back from the Presets view to the Calendar view.
Non-Date Filter Cards
15. Modifying non-date filters
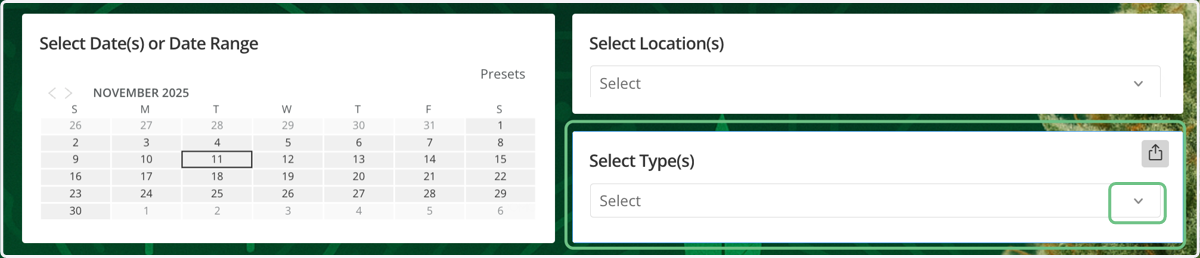
There are other types of filter cards that will allow you to select from a dropdown list of choices. These choices reflect everything available in the client's data.
Click the down arrow to open up the list of dropdown options. Click the checkbox for as many options as you'd like to see the data displayed for.
16. Modifying non-date filters
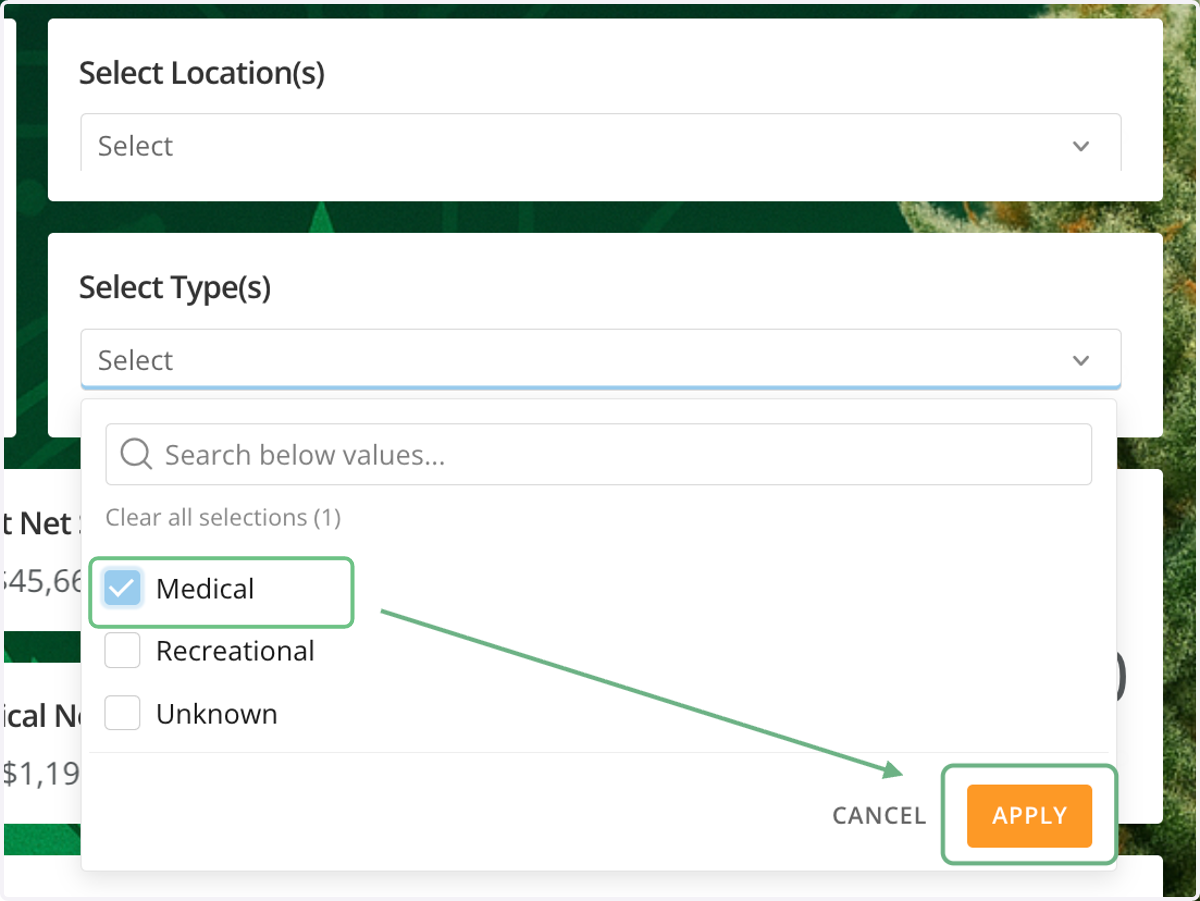
You can check/uncheck individual options within the dropdown filter.
Be sure to click "Apply" in the bottom right corner after choosing any filter selections. Otherwise, the filter will not take effect.
Page-Level Filters
17. Page-Level Filters
Besides the card filters, there are page-level filters. These typically appear after you interact with filters within the dashboard.
Click on the funnel icon in the top right to display these page-level filters.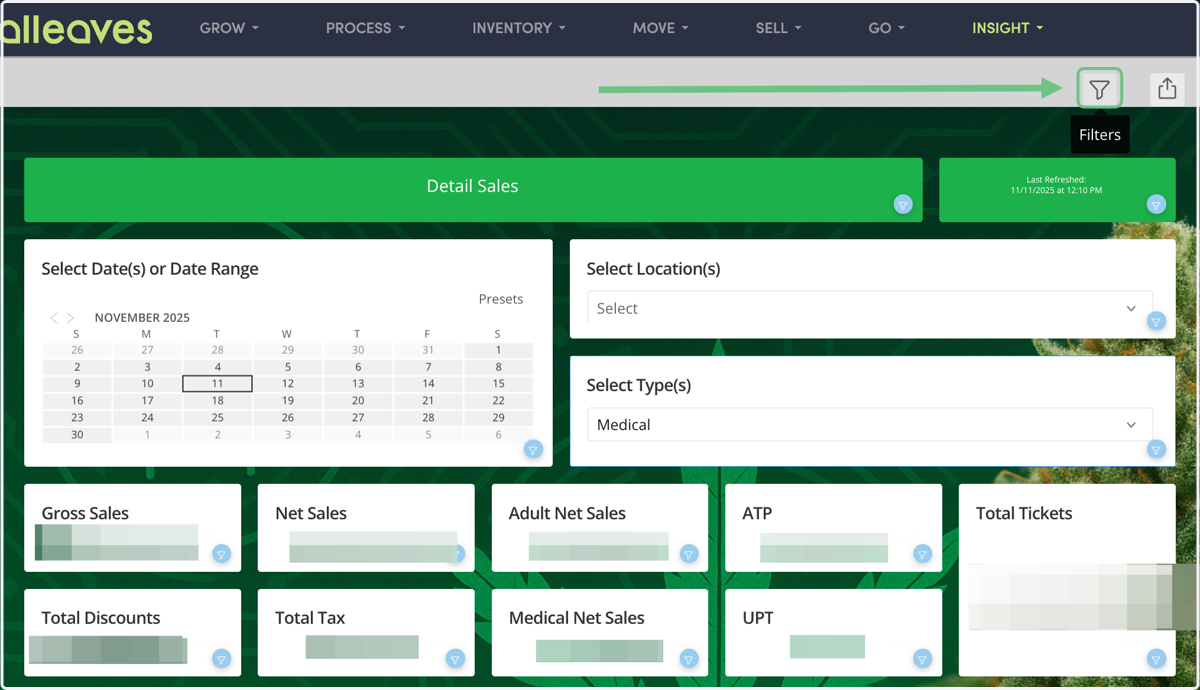
18. Page-Level Filters
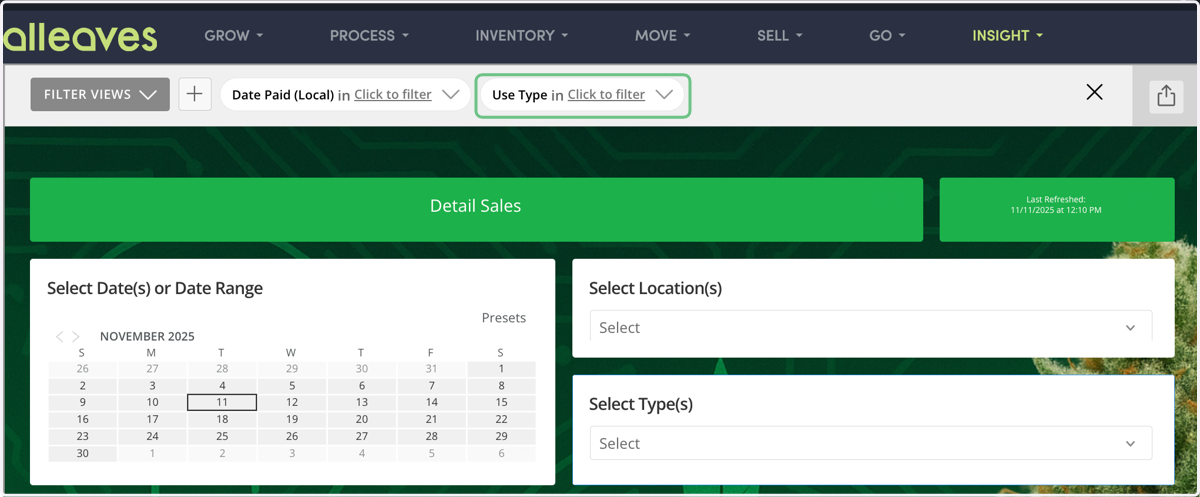
Because we interacted with the card filter for use type, the page-level filter appears.
19. Modifying Page-Level Filters
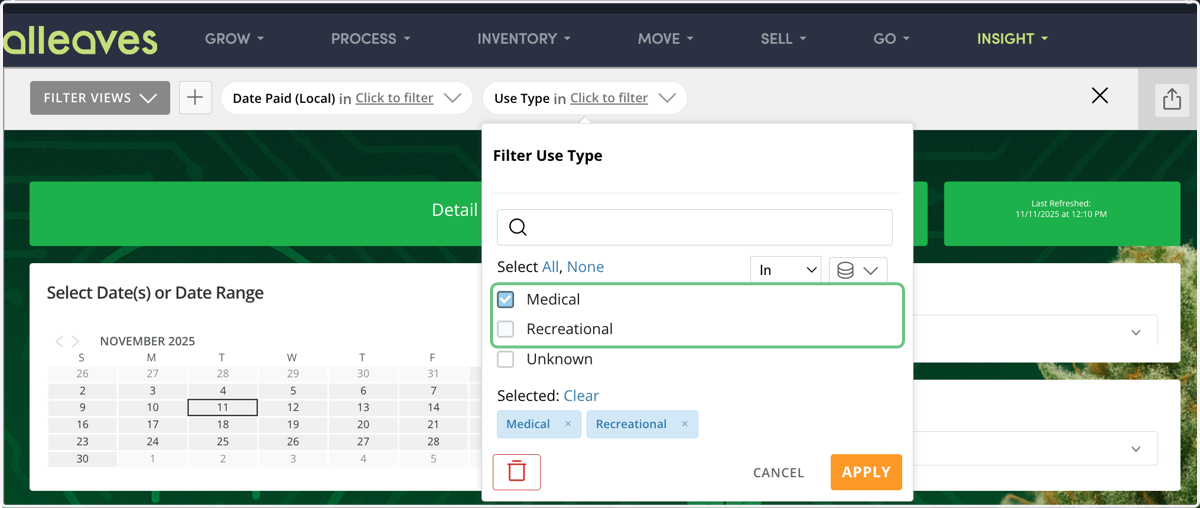
You can check/uncheck individual options within the dropdown filter.
20. Modifying Page-Level Filters
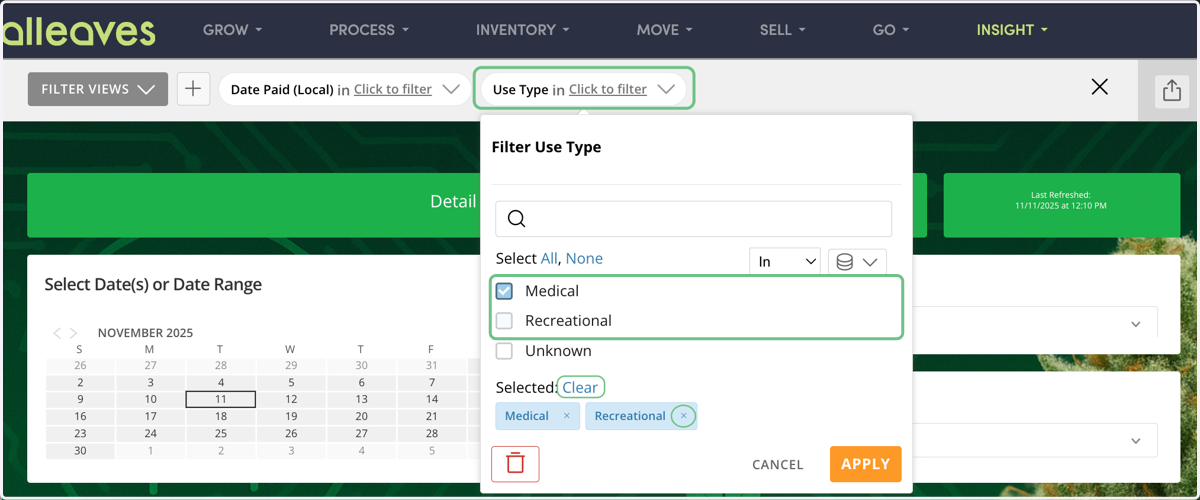
Look to the bottom of the dropdown list popup to click "Clear" next to "Selected" to remove all options selected, or click "x" next to individual options to remove them. This option is particularly helpful if the dropdown list is long.
21. Modifying Page-Level Filters
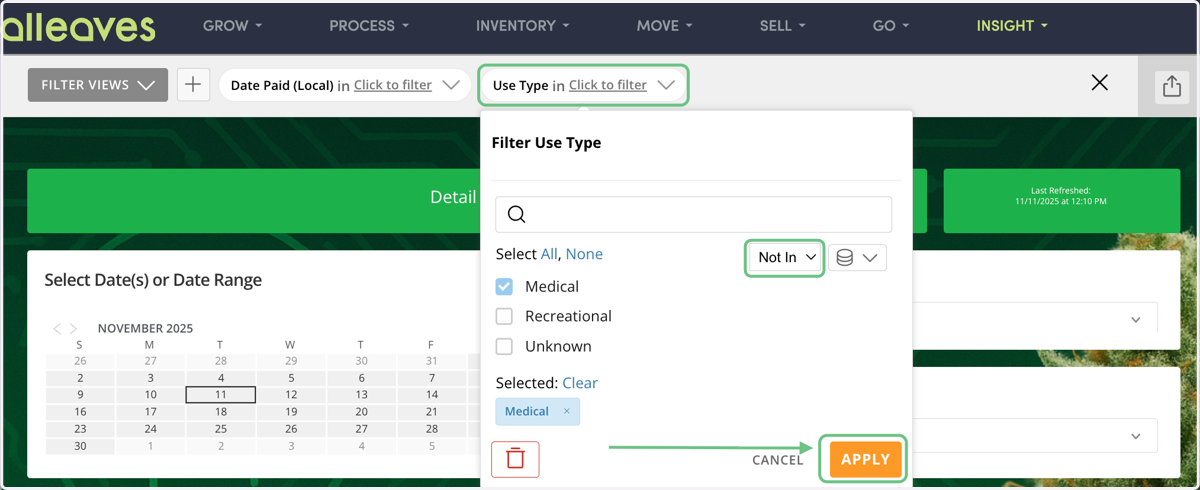
You can also change the default selection type from "in" to "not in". This acts as an exclusion filter, rather than an inclusion filter like the default.
Be sure to click "Apply" in the bottom right corner after choosing any filter selections. Otherwise, the filter will not take effect.
22. Modifying Page-Level Filters
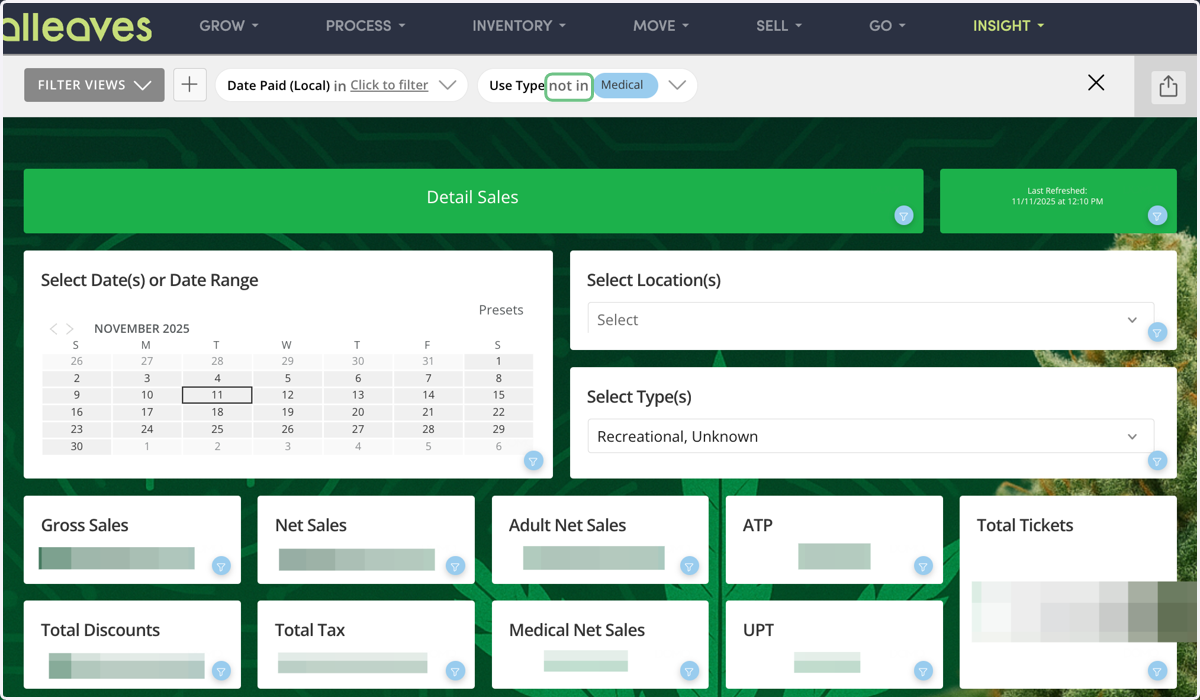
Note that the page-level use type filter updates to "not in" instead of "in".
23. Modifying Page-Level Filters
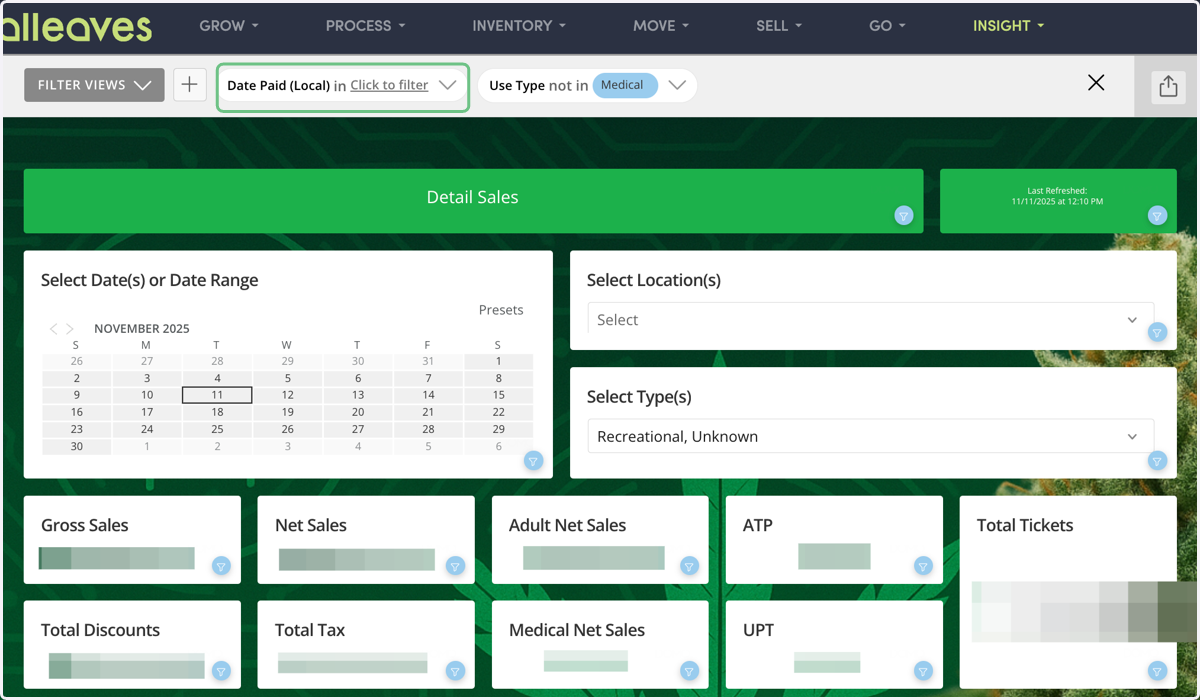
Let's look at the Date Paid page-level filter.
24. Modifying Page-Level Filters
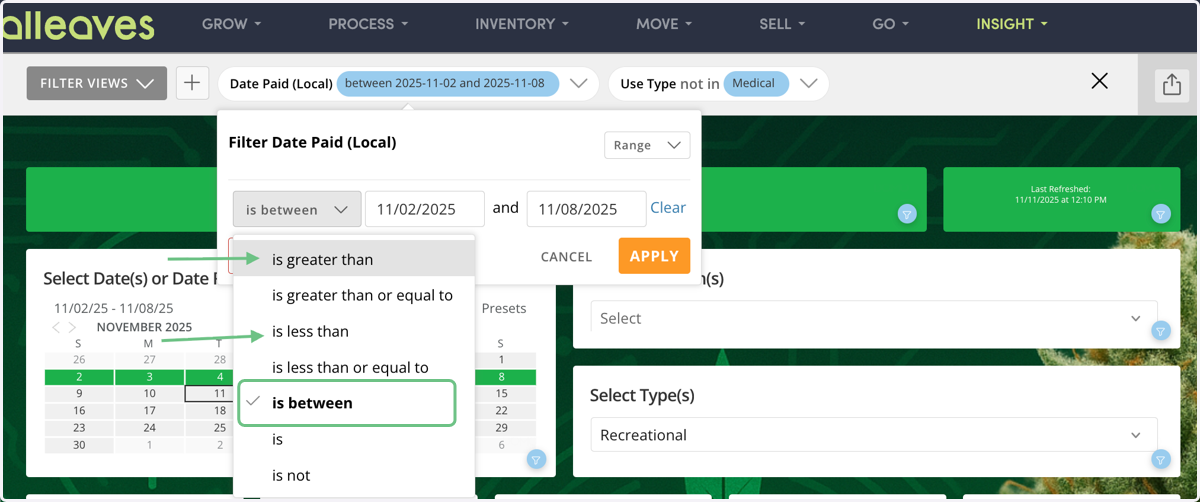
The default selection here is "is between" to define a range. However, you can choose another option to give you a different type of filtering.
For example, "is greater than" would give you dates after the date you specify.
Similarly, "is less than" would give you dates before the date you specify.
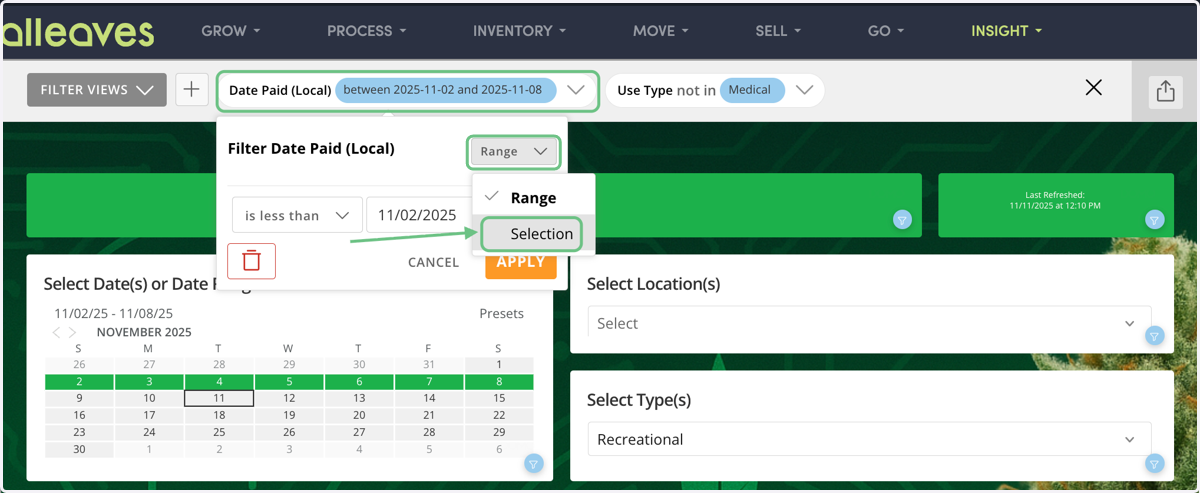
25. Modifying Page-Level Filters
The default selection here is "range". However, you can choose "selection" to give you a list of dates to check/uncheck.
26. Modifying Page-Level Filters
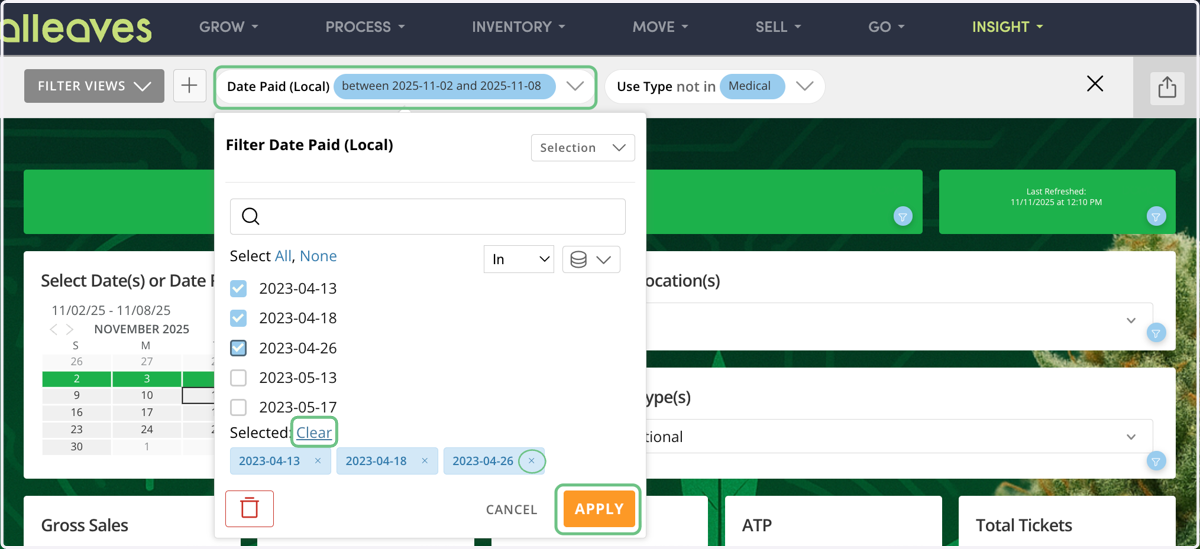
After making filter choices, you can click "Clear" next to "Selected" to remove all options selected, or click "x" next to individual options to remove them. This option is particularly helpful if the dropdown list is long.
Be sure to click "Apply" in the bottom right corner after choosing any filter selections. Otherwise, the changes will not take effect.
Sorting and Filtering Tables
27. Data Tables
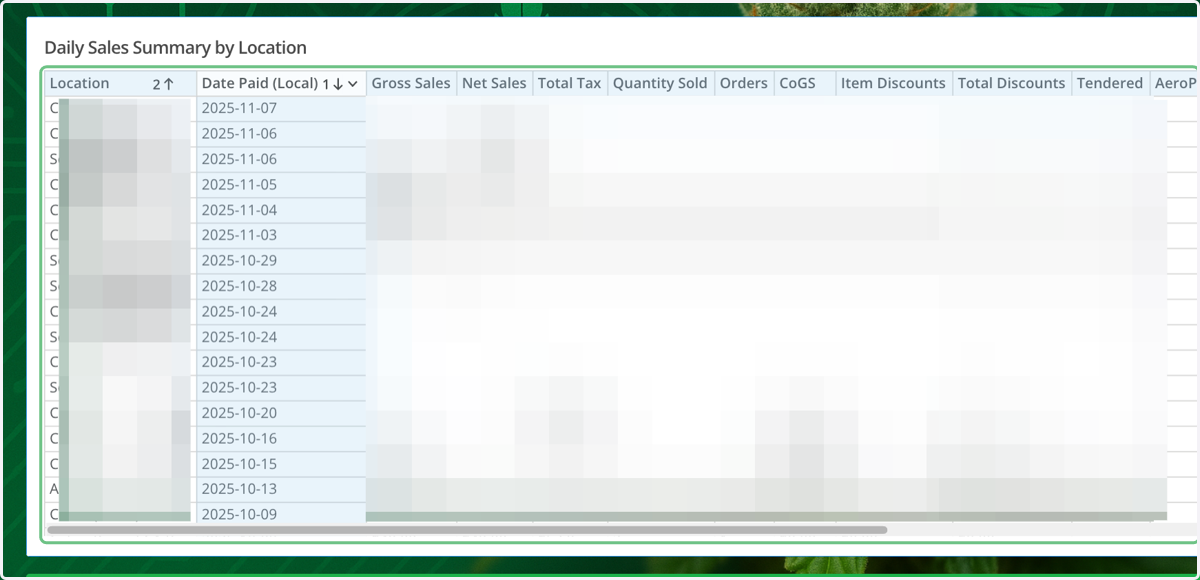
You can also filter the data displayed on the dashboard by clicking on a field within the data table (specific date, specific location). You are also able to sort the data displayed by clicking on the arrow for a specific field to change the direction of the data (ascending/descending).
By default, most reports show data in descending order by date (newest date first).
28. Sorting Data Tables
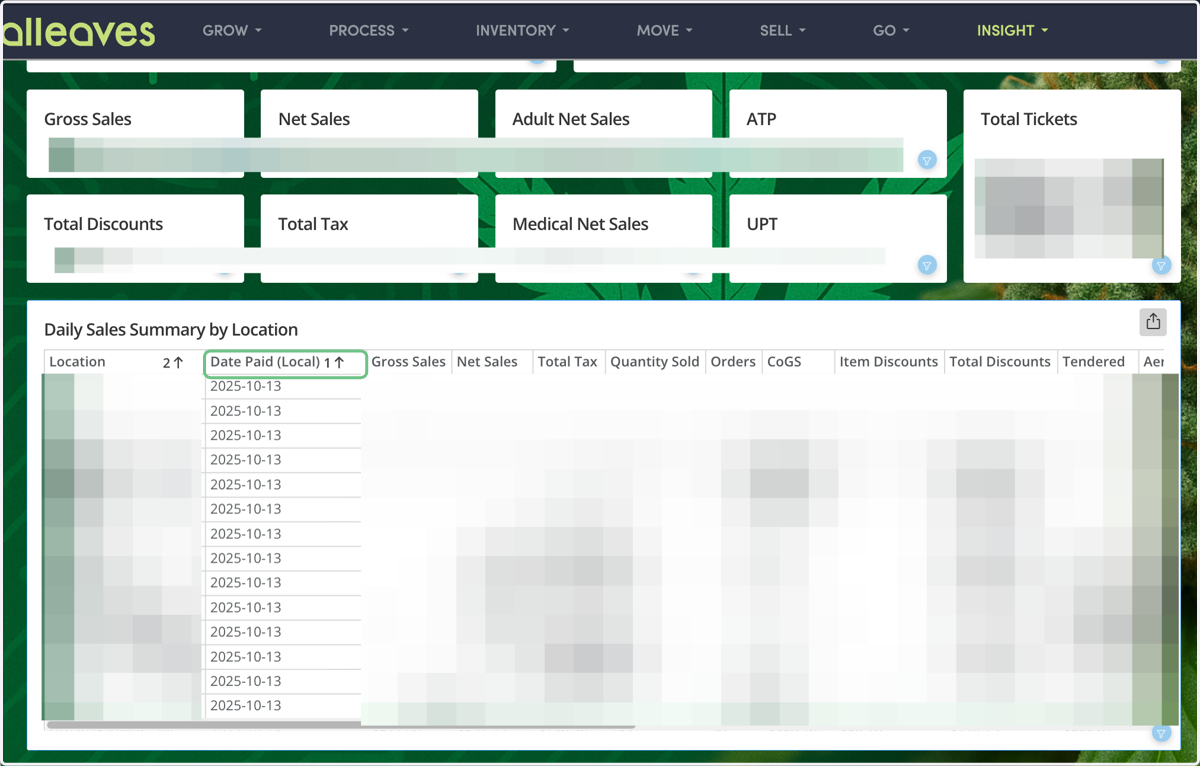
Clicking on the arrow next to any header row changes sorting from ascending to descending and descending to ascending.
This shows sorting the date column in ascending order (oldest date first).
When sorting an alphabetical column, ascending is A - Z and descending is Z - A.
When sorting a numerical column, ascending is 0 - 100... and descending is 100... - 0.
29. Filtering Data Tables
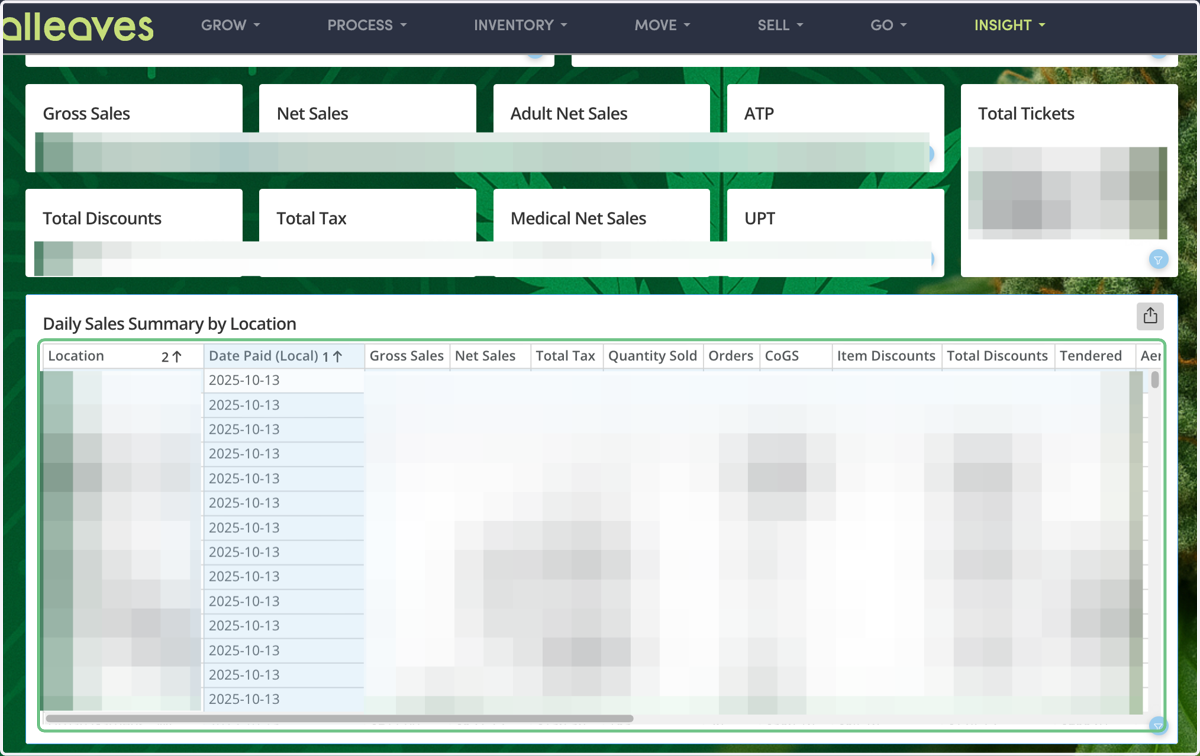
The last way to filter dashboards to specific dates is to click on a date within a table.
30. Filtering Data Tables
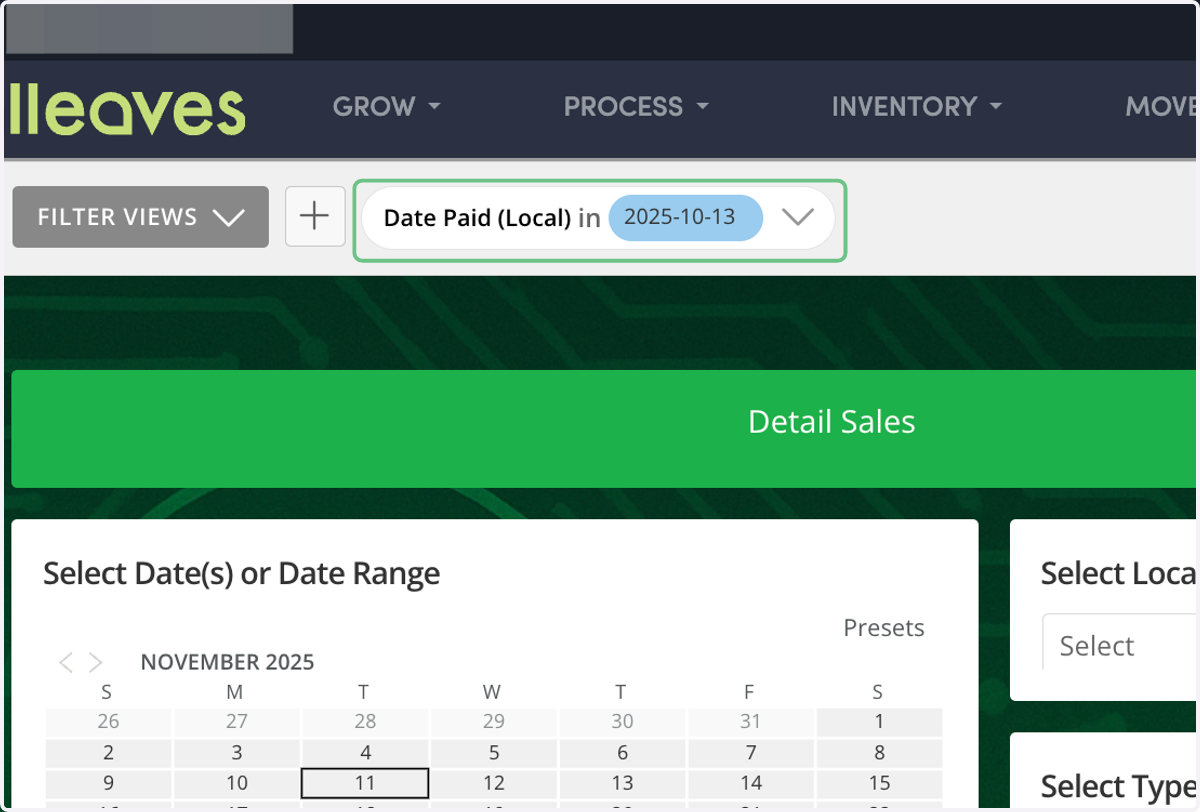
Note that the date clicked in the table last step is reflected in the page-level filter. The filter will apply to all summary metric cards by default.
To get this filter to affect the data shown in the table, you have to click the down arrow and hit "apply" for those changes to take effect. You can also achieve this effect by selecting the date on the Date Selector card.
Drill Through Tables
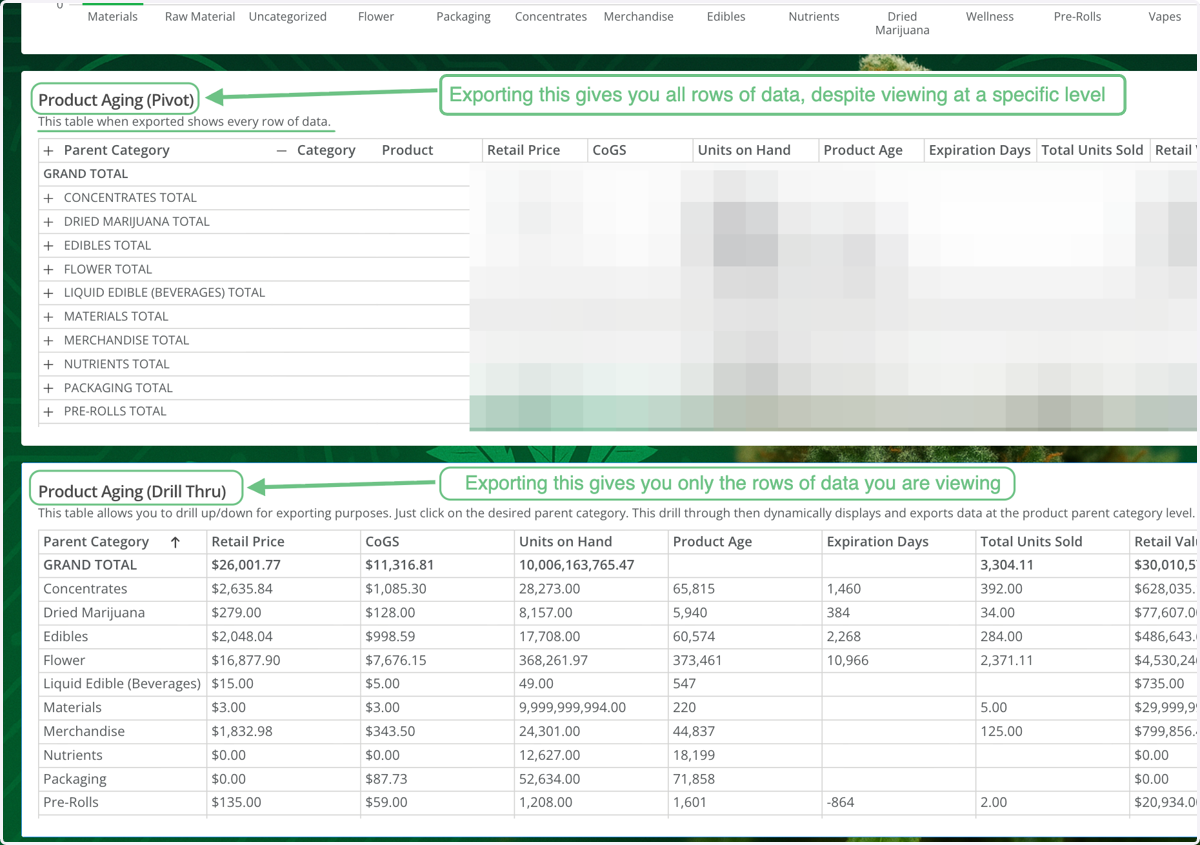
Pivot tables are great, but when exporting pivot tables you get all rows of data despite what your view shows. In times where you want to drill up/drill down into a specific level of detail to only export the level of data you are viewing, Drill Through tables fulfill this purpose.
Currently, Product Aging is the only report that has this functionality.
Alleaves > Insight > Domo > Inventory > Product Aging
31. Pivot Table
Exporting a pivot table, regardless of maximizing or minimizing rows of data, will shows all rows of data when exported.
If you're looking for the export to match the level of data you're viewing, use the "Drill Thru" table.
32. Drill Through Table
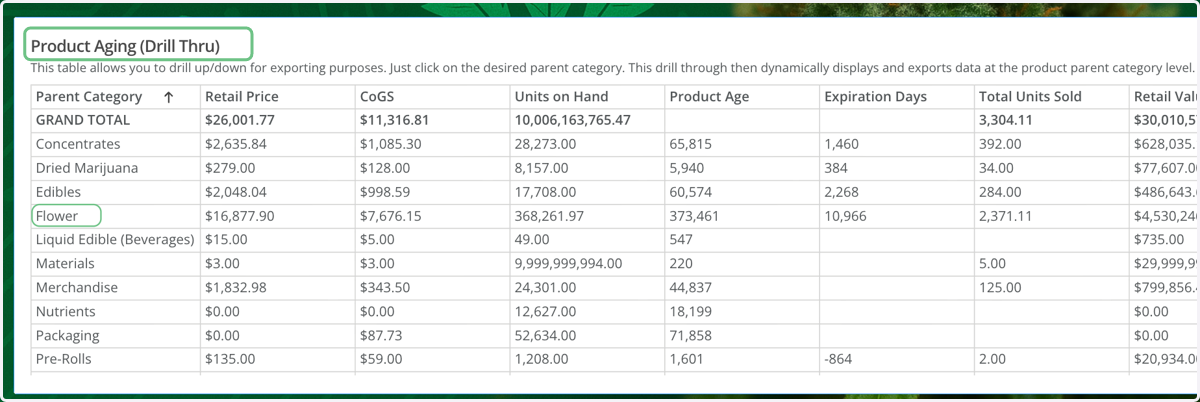
This table allows you to drill up/down for viewing or exporting purposes. Just click on the desired parent category in the first column. This table then dynamically displays and exports data at the product parent category level.
Let's click on "Flower" in the first column.
33. Drill Through Table
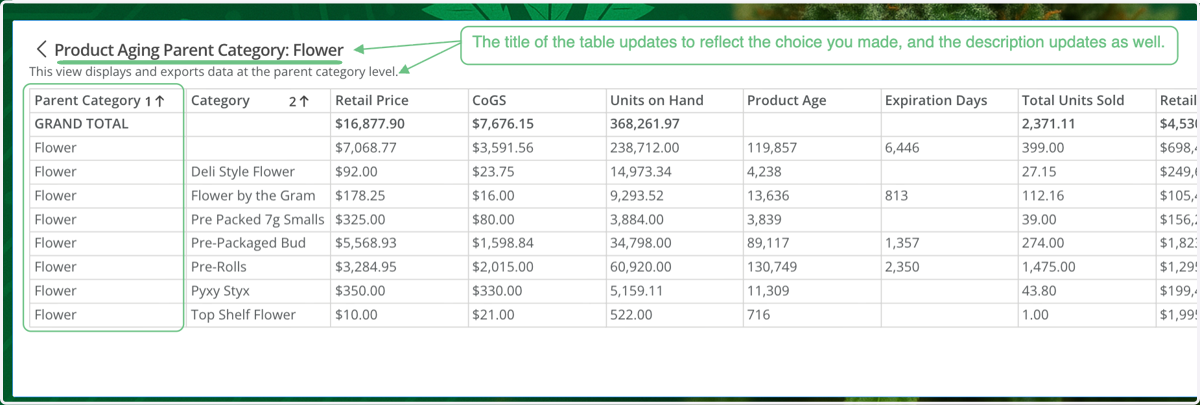
Note the title and description of the table changes, and you can only see "Flower" in the first column of the table.
The table is fixed at the parent category level. If you were to export the table in this state, the export would only show this view and no more data.
34. Drill Through Table
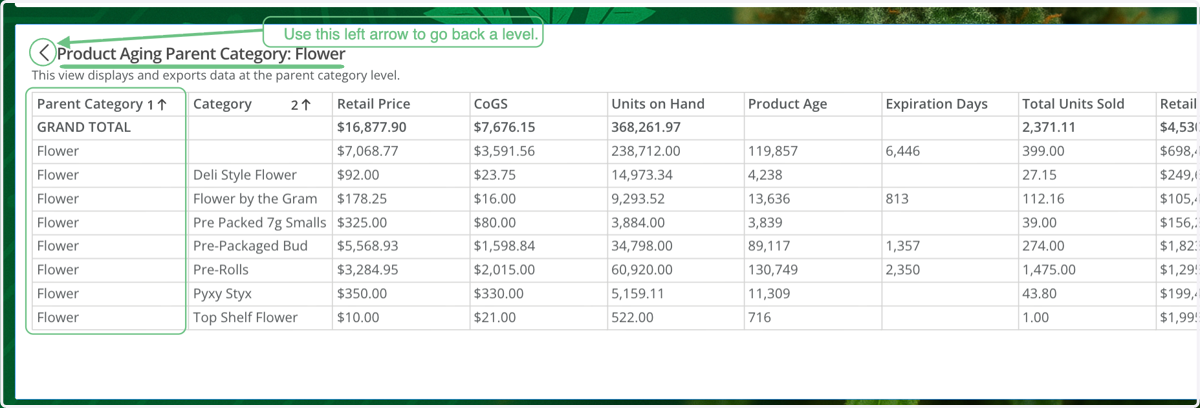
You can click the left arrow to return to your previous view.
35. Drill Through Table
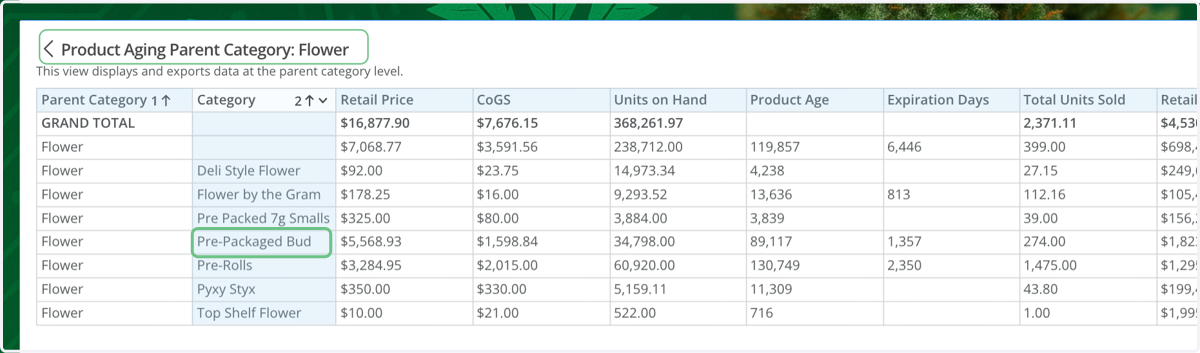
Let's click on "Pre-Packaged Bud" in the second column.
36. Drill Through Table
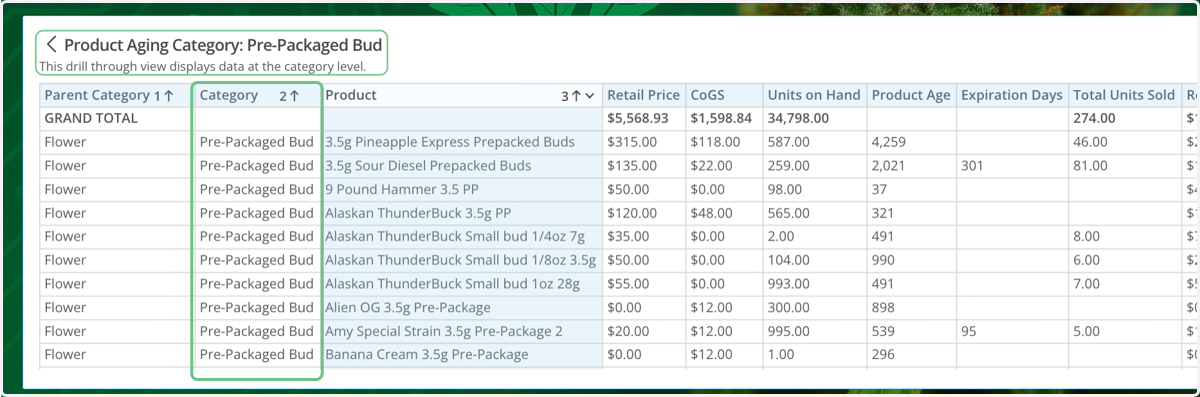
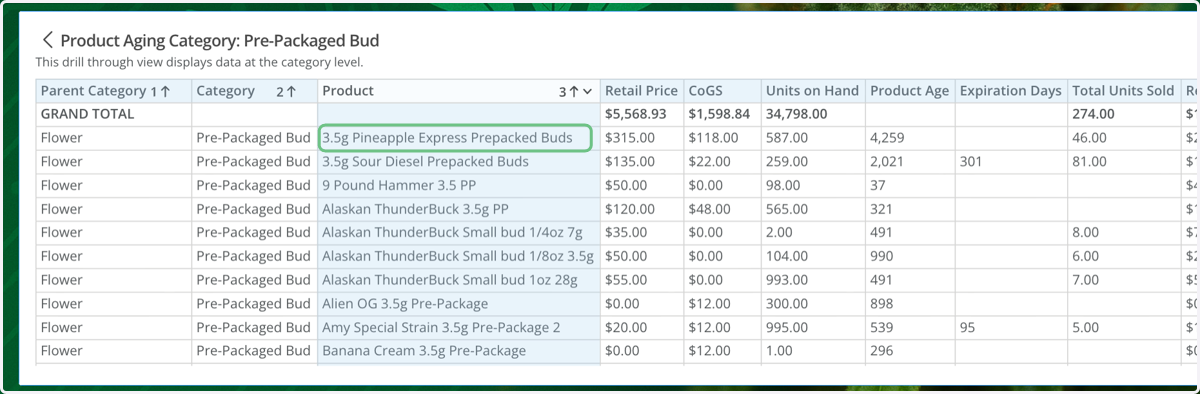
Note the title and description of the table changes, and you can only see "Pre-Packaged Bud" in the second column of the table.
The table is fixed at the category level. If you were to export the table in this state, the export would only show this view and no more data.
37. Drill Through Table
Let's click on "3.5g Pineapple Express Prepacked Buds" in the third column.
38. Drill Through Table
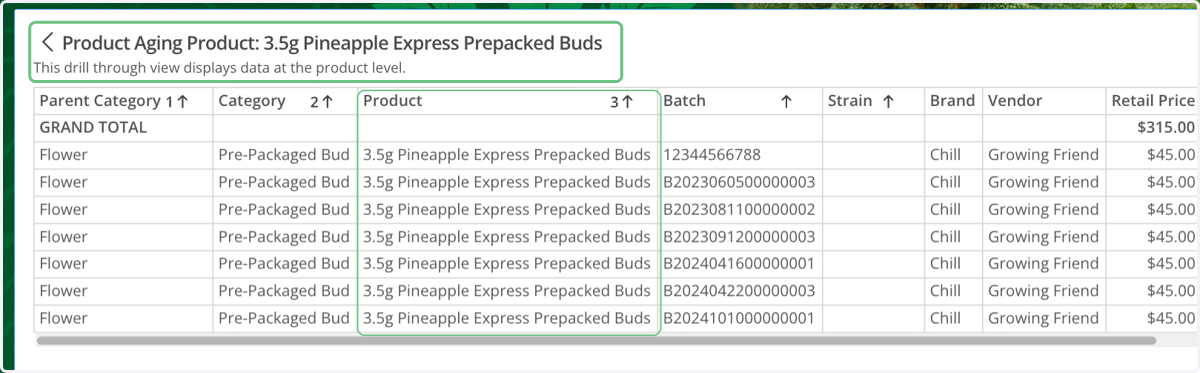
Note the title and description of the table changes, and you can only see "3.5g Pineapple Express Prepacked Buds" in the third column of the table. This now allows for additional product-level information to show including batch, brand, vendor, and strain.
The table is fixed at the product level. If you were to export the table in this state, the export would only show this view and no more data. To export all rows of data, use the pivot table above.
39. Conclusion
This concludes the Basic Analytics user guide.
For inquiries about updating your product to Premium Analytics, please reach out to the Alleaves team.
Premium Analytics includes additional capabilities compared to Basic Analytics, including:
A custom-built Domo site specifically for your facilities/dispensaries.
One stop shop. Multi-org/facility reporting centralized in one site.
Customized reports pointing to any of the 17 pre-aggregated (and fully vetted) datasets from Alleaves.
Ability to customize reports, edit reports, and share these reports with others or choose to keep it to yourself.
Schedule reports with full control of frequency and recipients.
Set alerts for when data meets certain thresholds - ex: notify users when products have less than 20 units on hand.
Manage/tailor user access to reports and underlying data based on their role and location.