Automatic stockpiles recognition
Automatic stockpiles recognition
1. NOTE!
The ability to use the "automatic stockpiles recognition" function is available ONLY to users with the Administrator role assigned.
SkySnap
2. Select an organization.
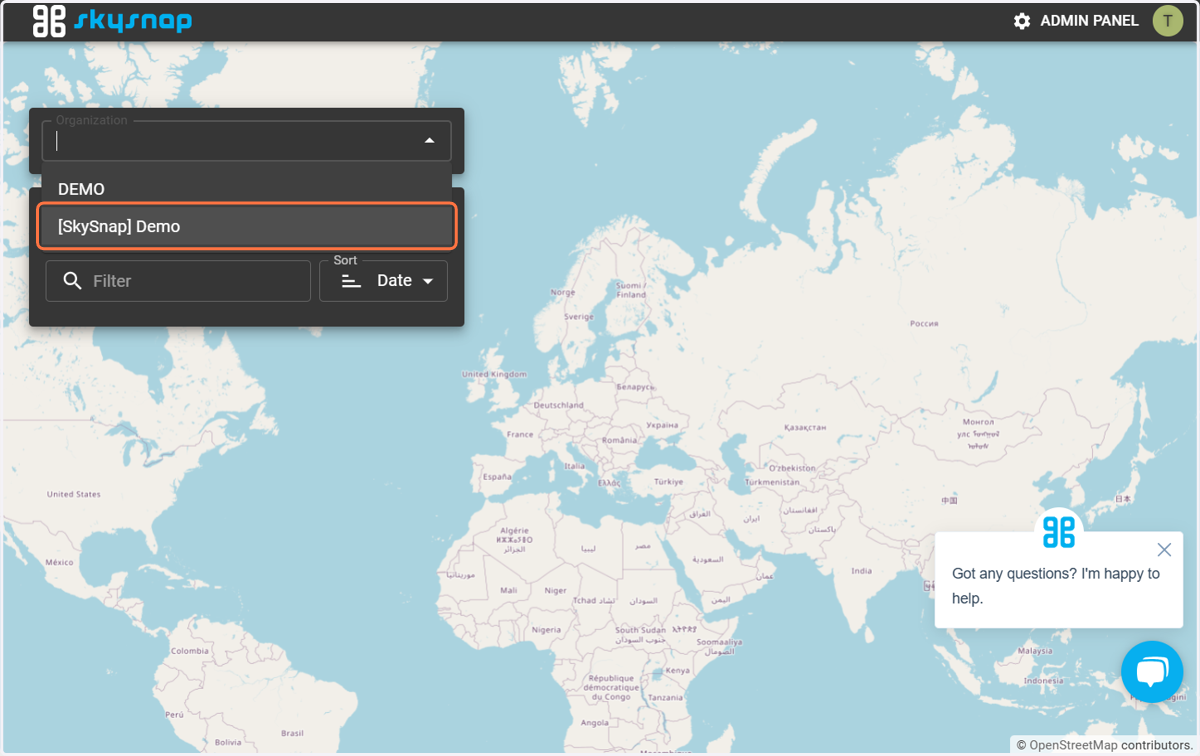
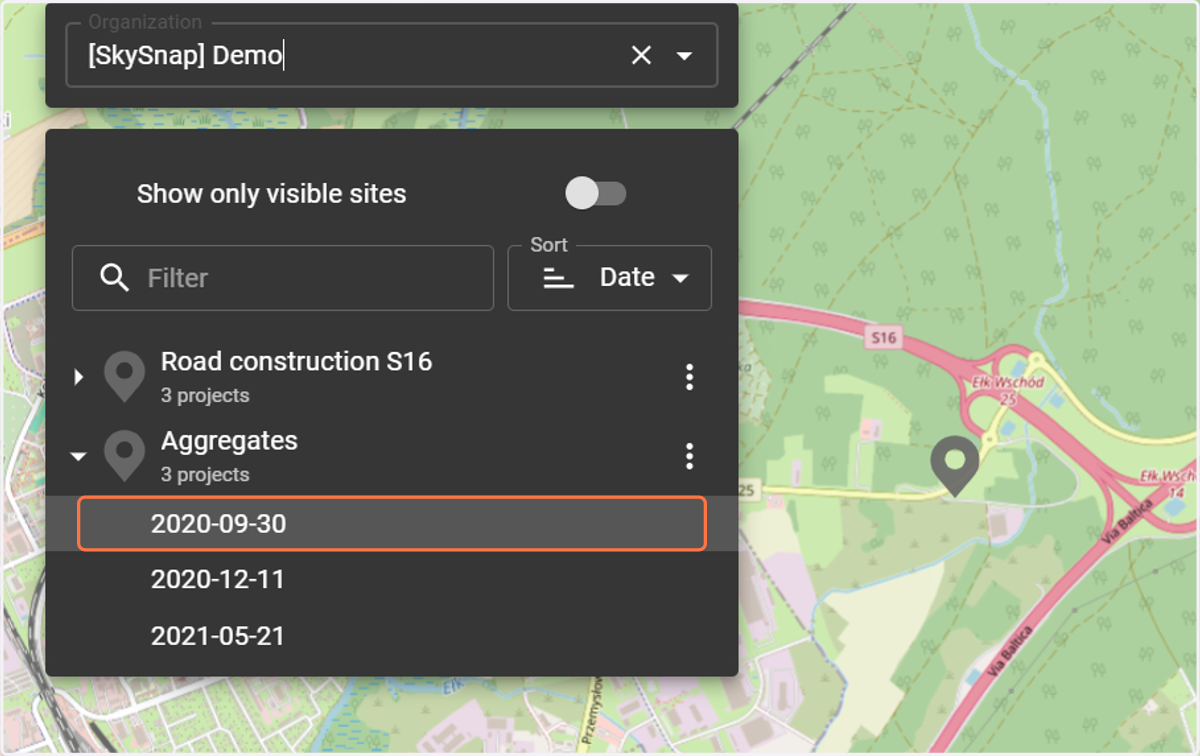
3. Select the site and project that interests you.
4. Click on the "Automations" tab.
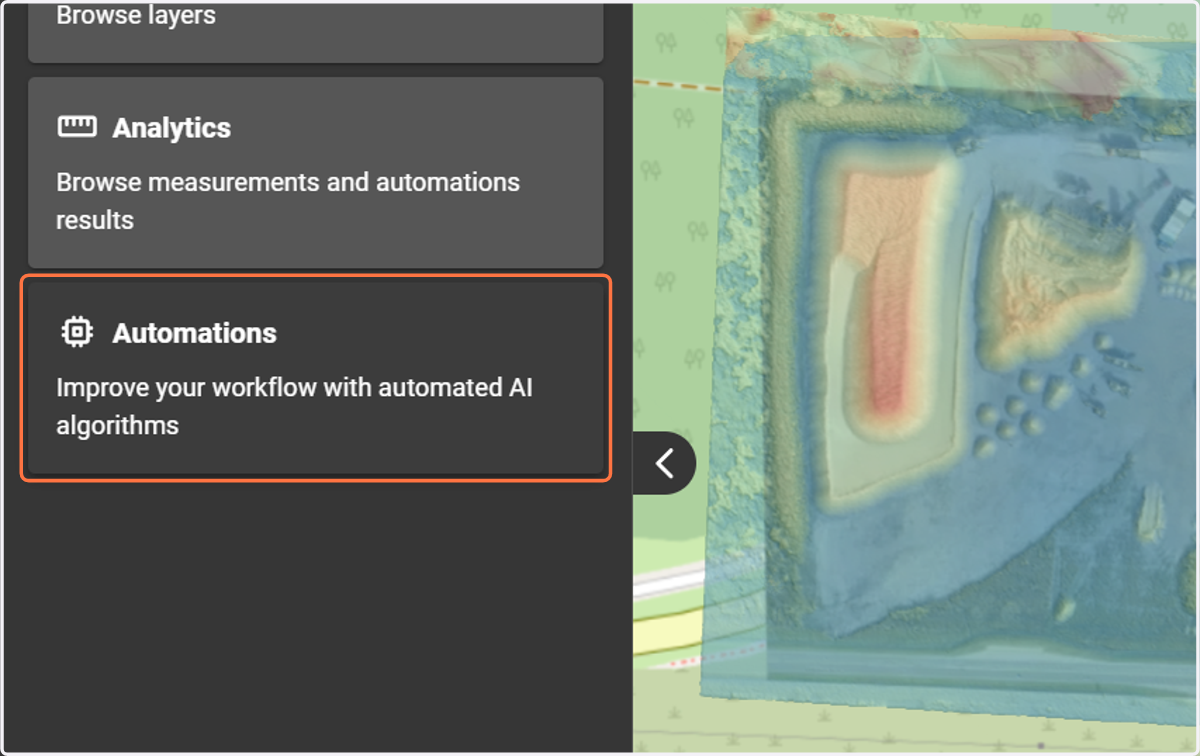
5. Two functions are displayed - "Stockpiles recognition" and "Automatic cross-sections". Select "Stockpiles recognition".
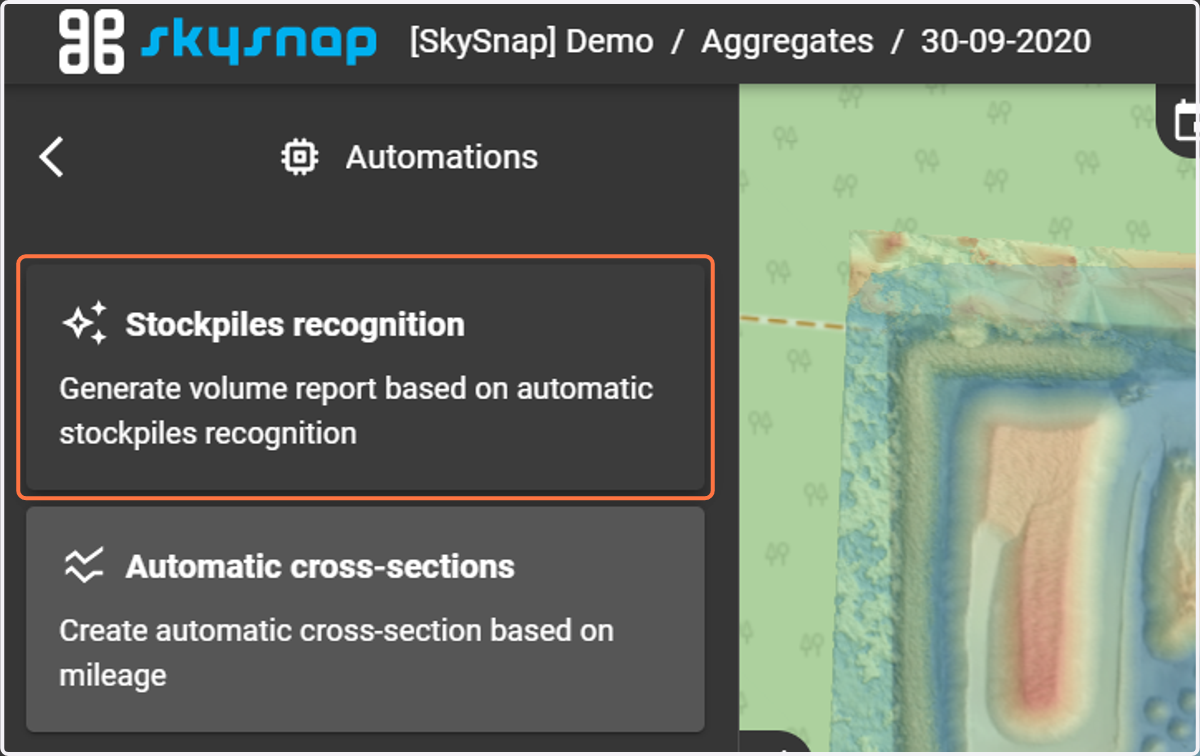
6. When you select the "Stockpiles recognition" function, you will see a window where you specify the layers and surfaces from which the volumes will be generated.
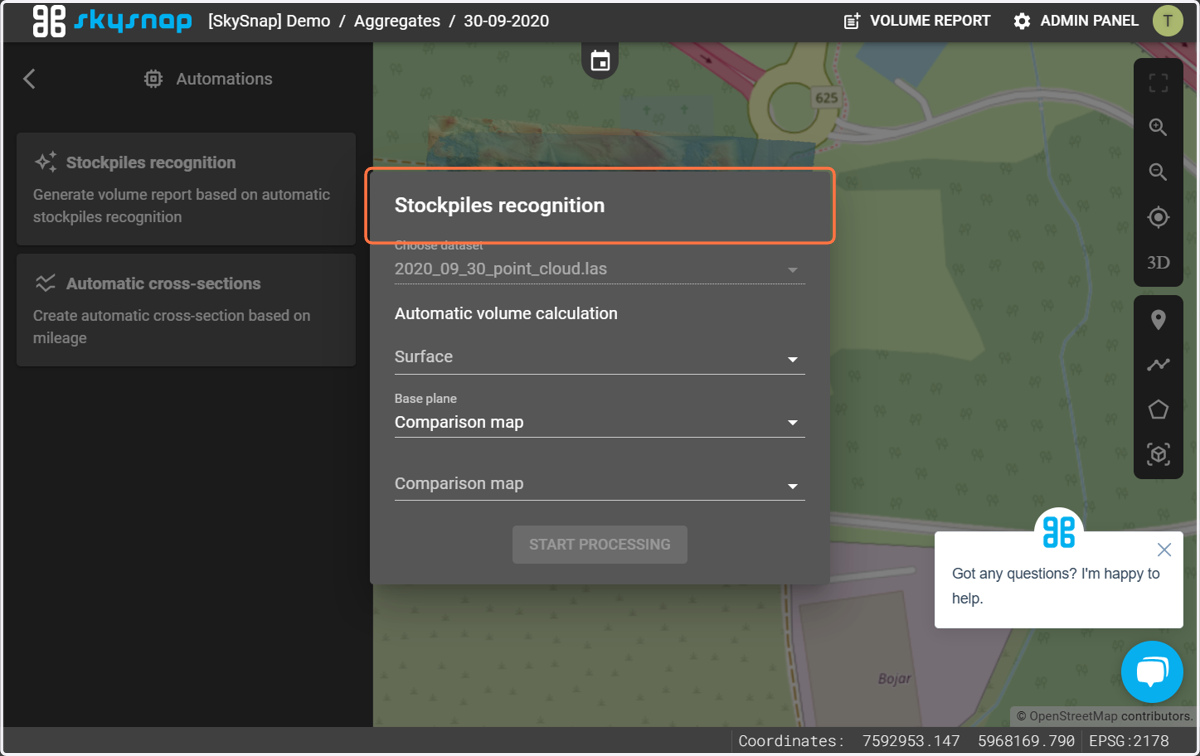
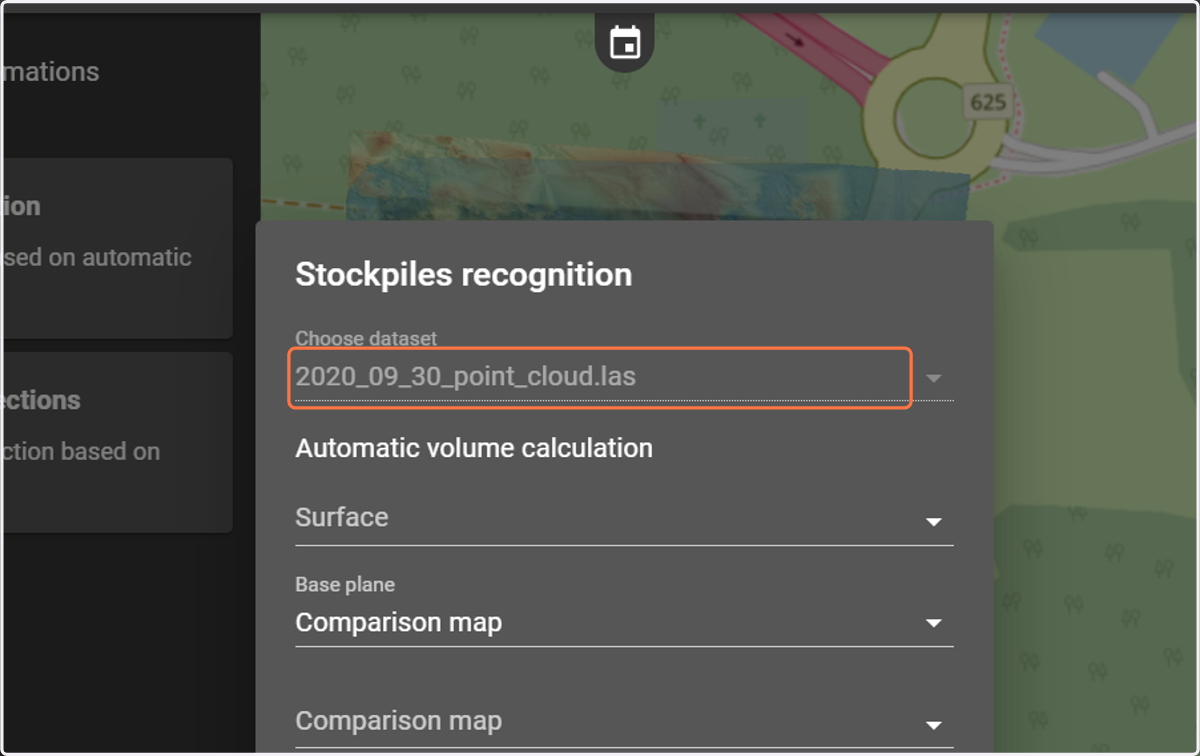
7. In the "Select data" section, select the layer with the point cloud (layer with the .las extension).
It is worth noting that a file with the .las extension is the ONLY appropriate one to use in this step. Files with the .laz extension are not supported.
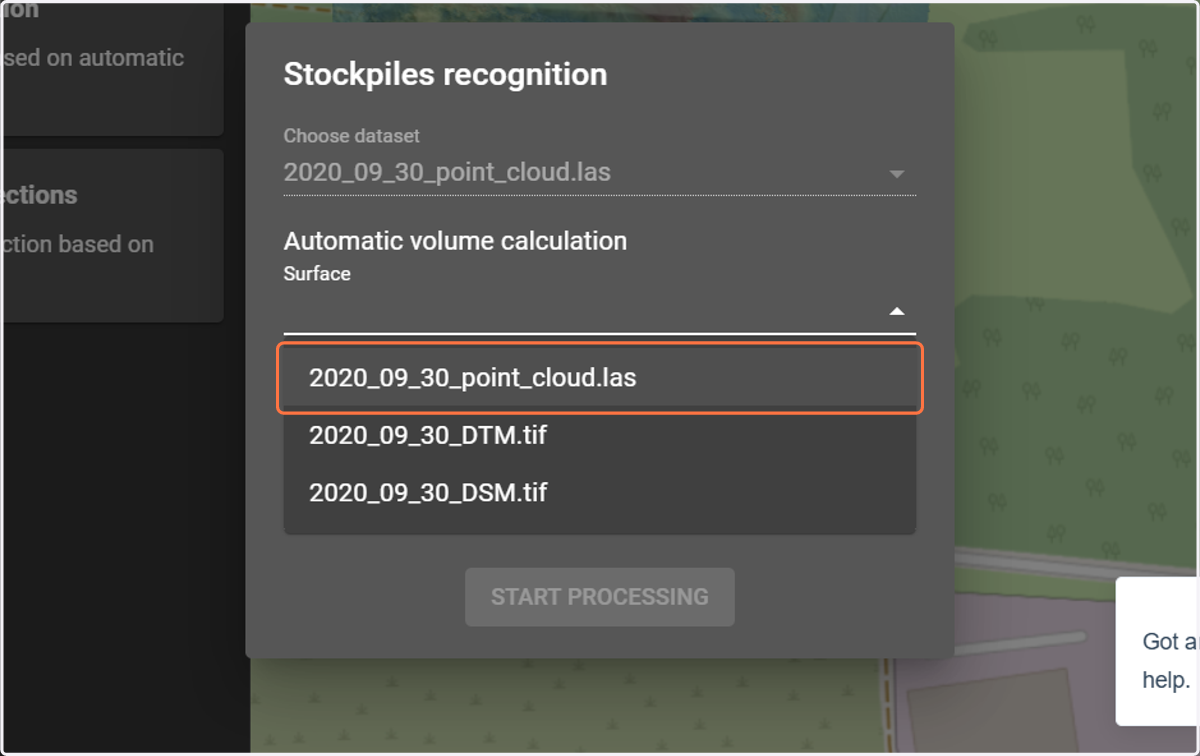
8. In the "Surface" section, select a point cloud layer (.las) or a raster surface (.tif).
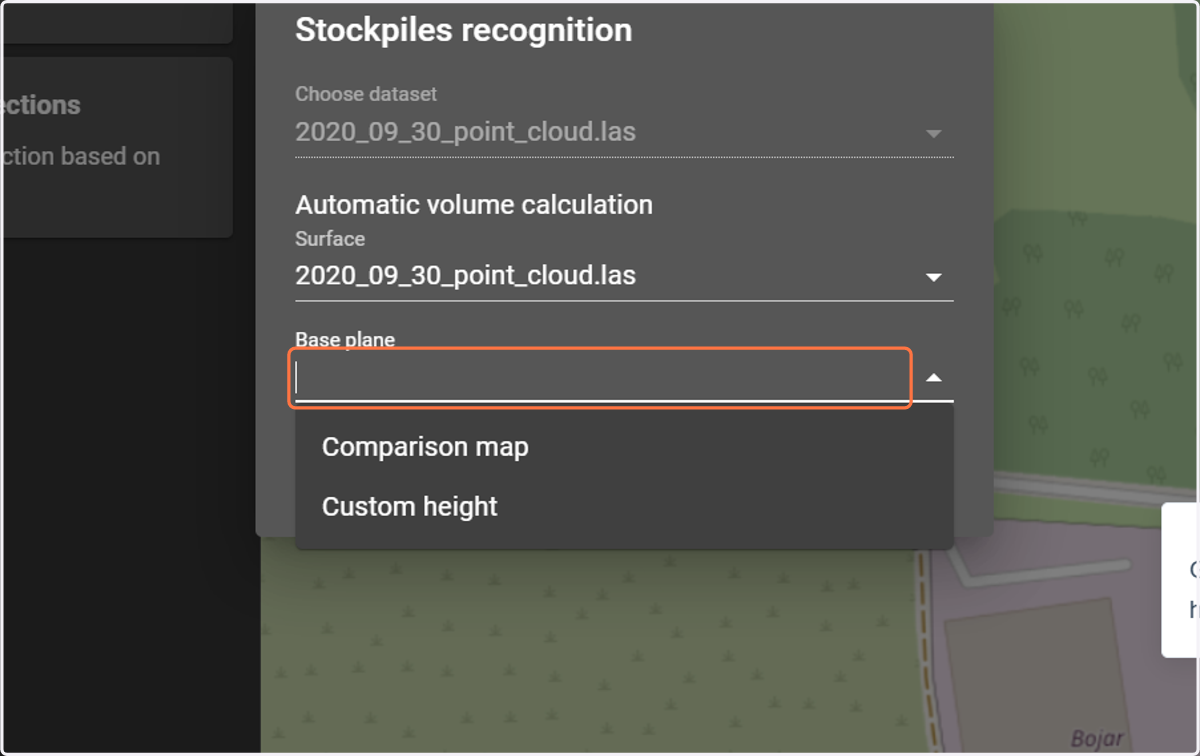
9. Select base surface.
The reference surface is the surface against which the volume will be counted.
Select one of two options:
"Custom height" to manually enter a value above sea level to create a flat surface that can mimic the zero state before construction.
"Comparison map" to select an existing surface in the form of a raster file or point cloud. Such surfaces can be, for example:
zero state
elevation data from another flight (then the difference between the two dates will be counted)
projected surface
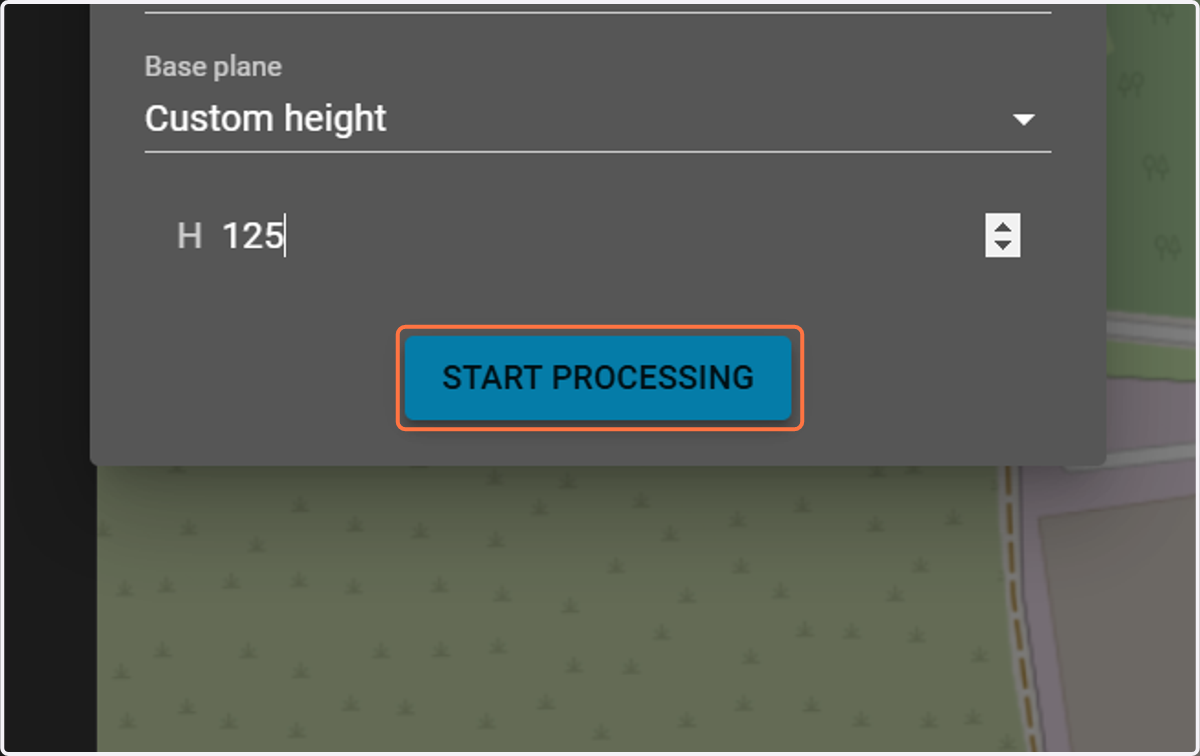
10. Click on "Start Processing".
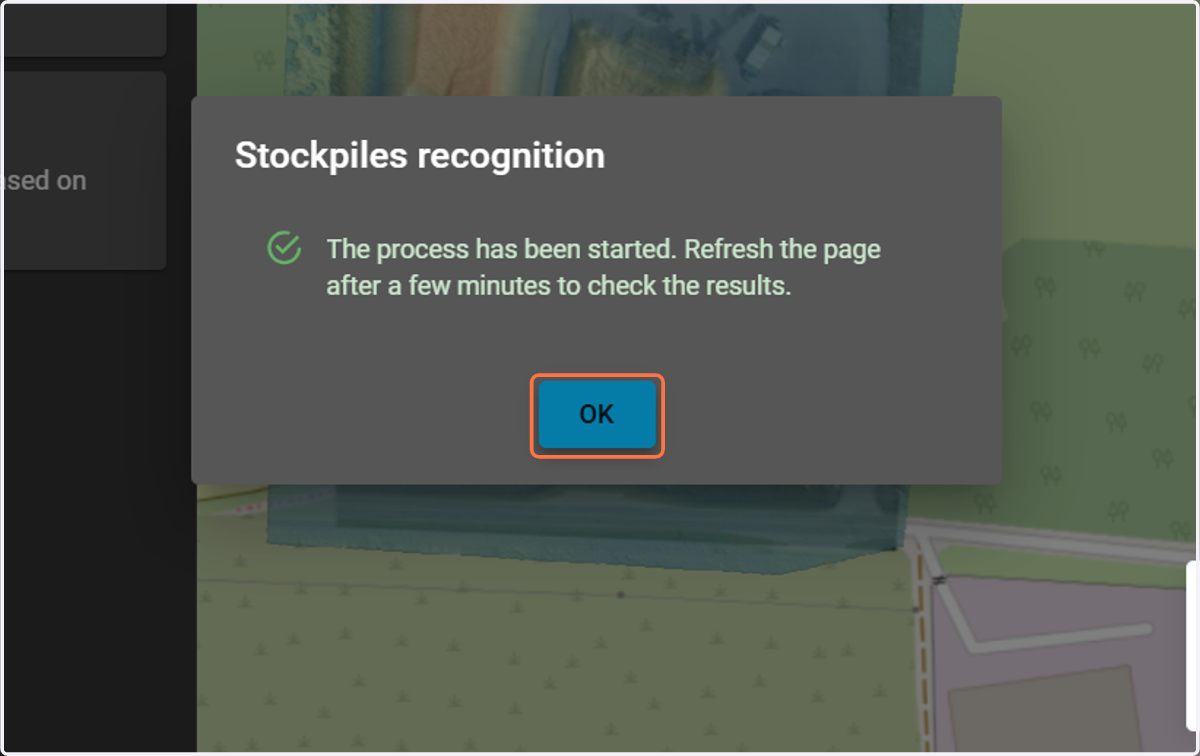
11. A message appears about the start of the stockpiles generation process.
12. After a few minutes, refresh the page and go to the "Analytics" tab, where all detected stockpiles will be visible.
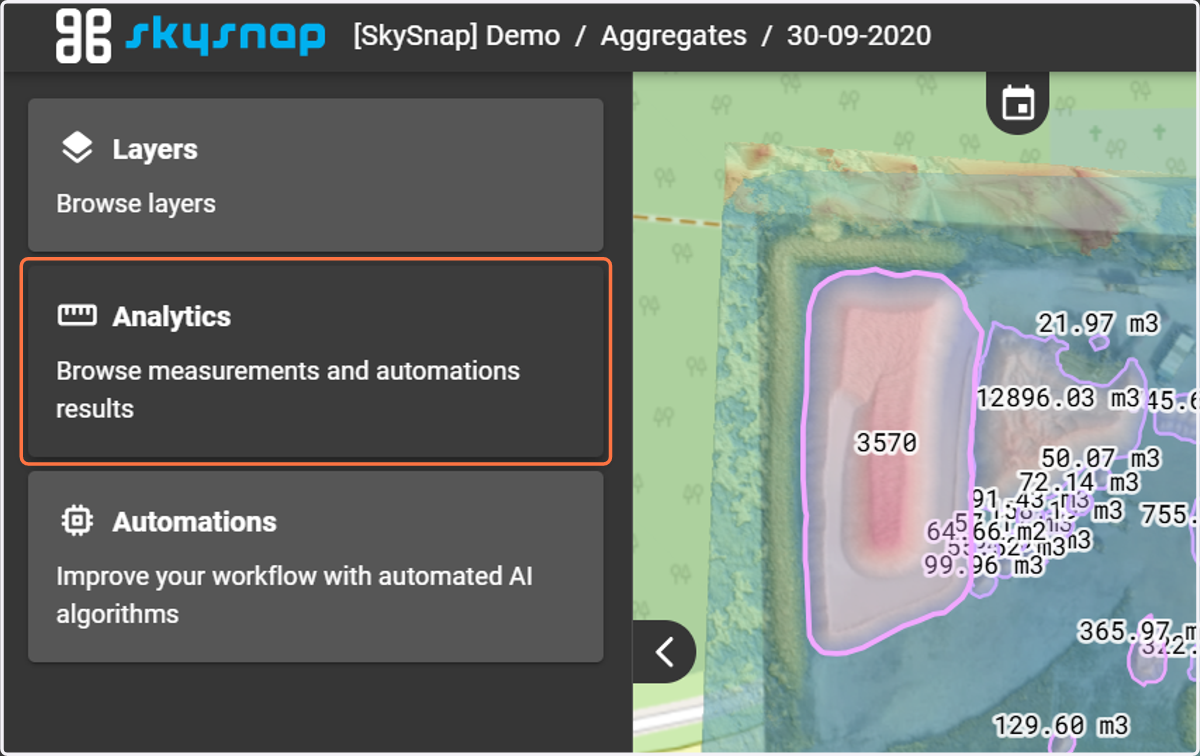
13. All stockpiles are visible on the map.
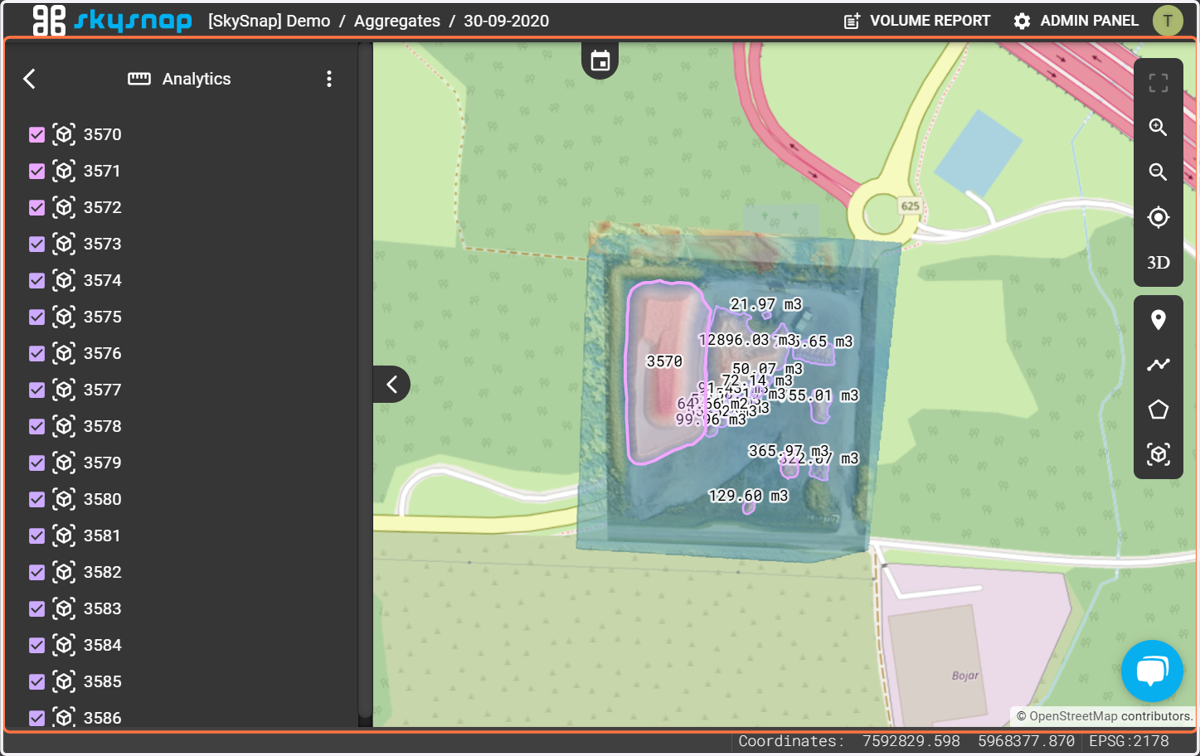
14. By clicking on the selected stockpile in the window on the left or directly on the map, you will see the parameters of the selected object and settings.
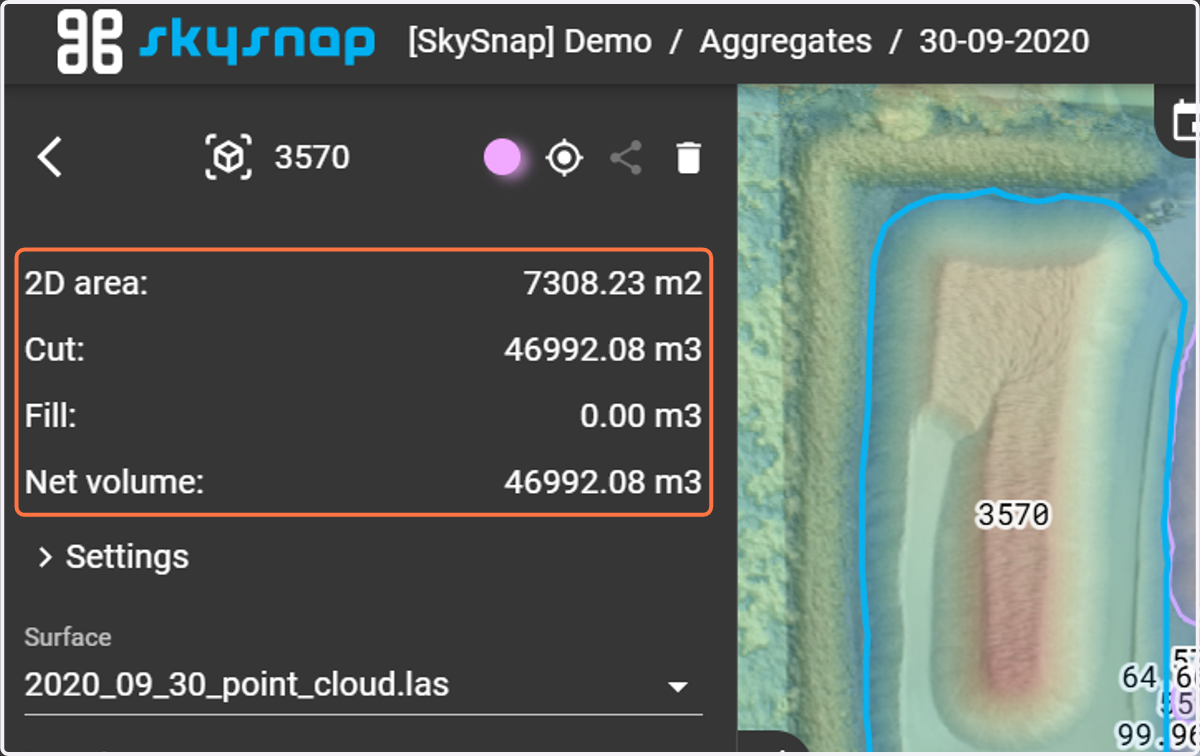
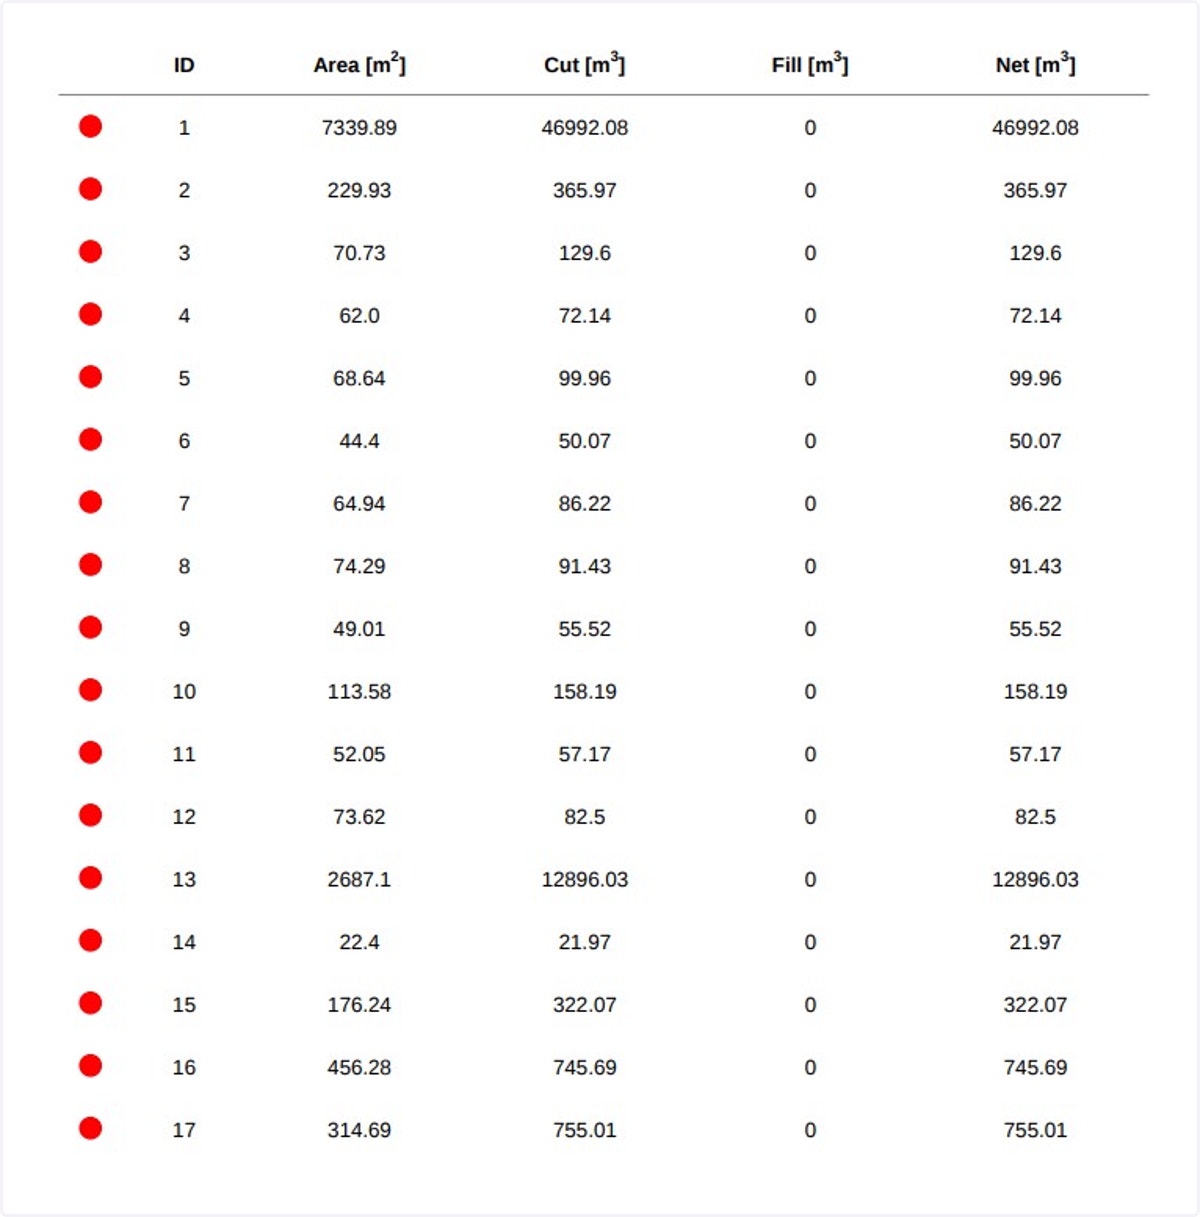
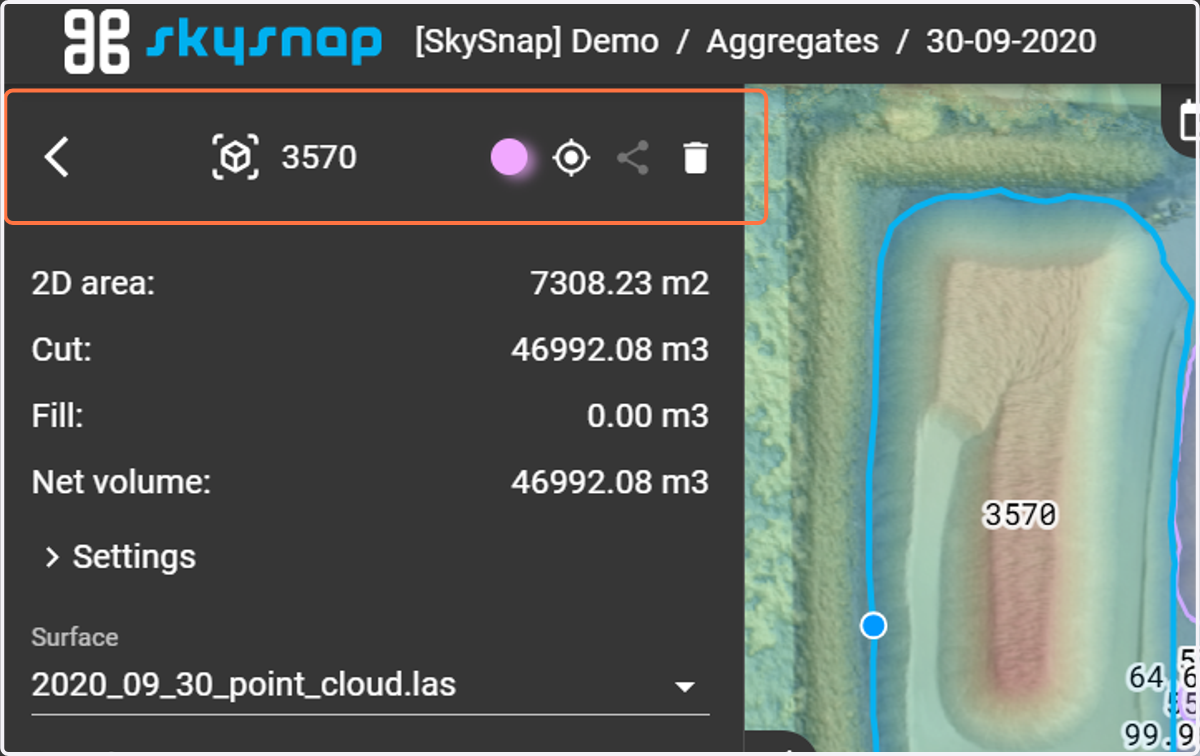
15. Here you can change the name of an object (double-click on its current name), assign a color to each object individually or delete it.
16. Settings allow you to define the label, line thickness and line style according to your preferences.
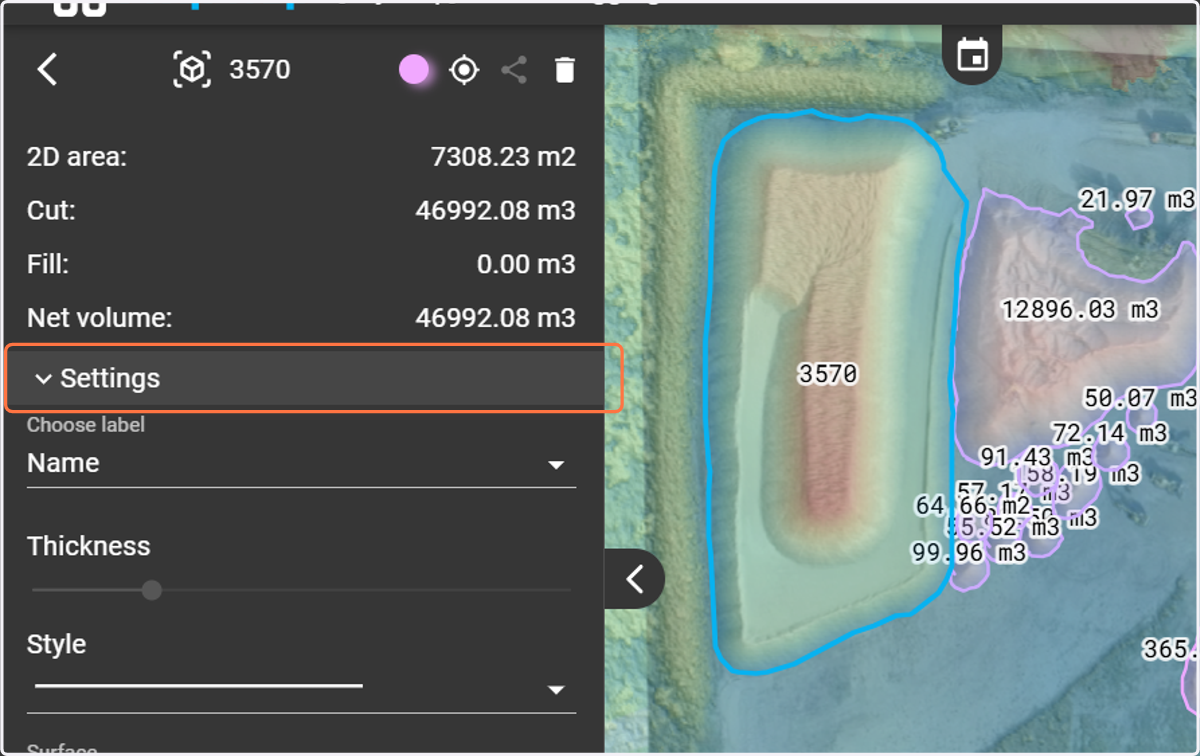
17. Here you can also edit the surface based on which volumes are calculated.
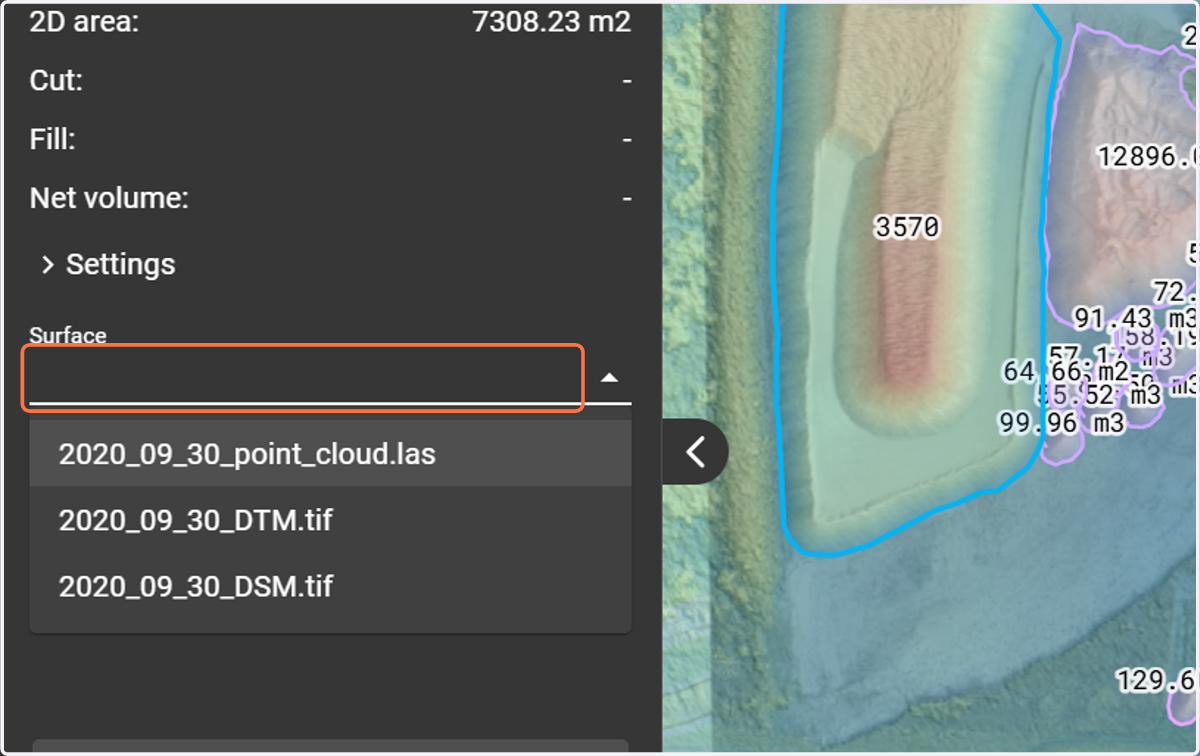
18. If the algorithm incorrectly finds the stockpile, it is possible to edit geometry of selected stockpile.
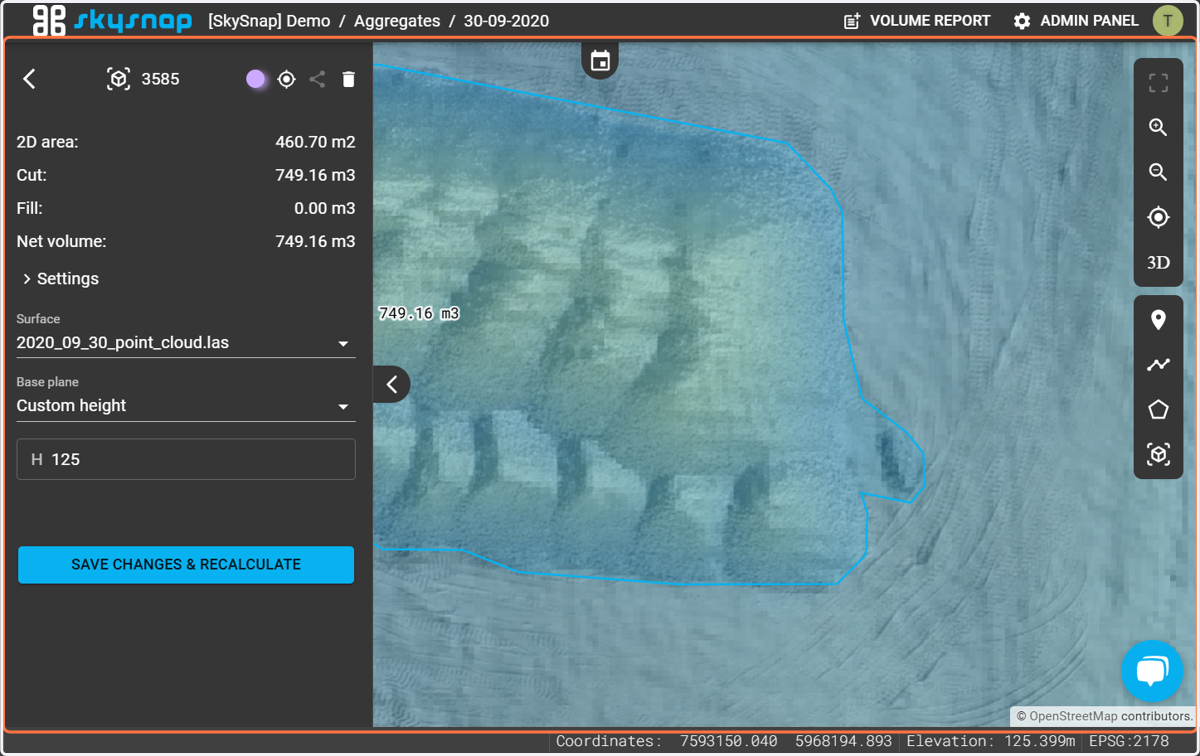
19. In this case, grab the vertex and adjust the shape to the size of the actual stockpile.
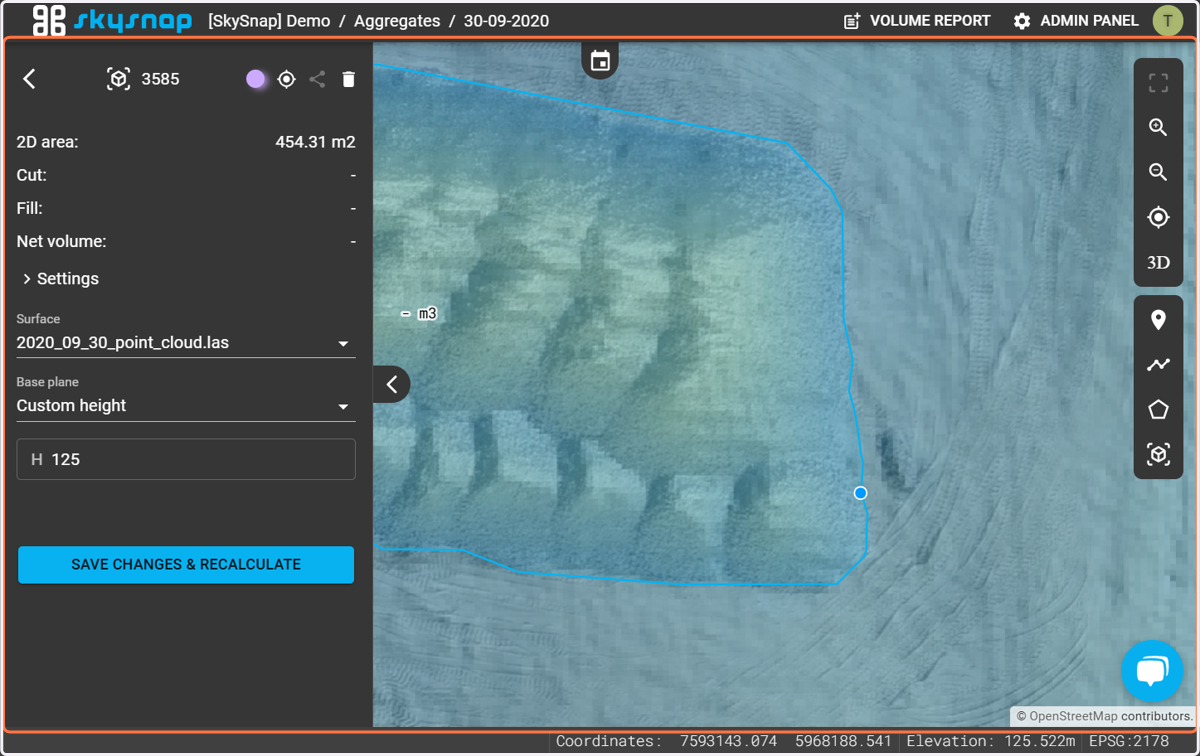
20. Click on "SAVE CHANGES & RECALCULATE"
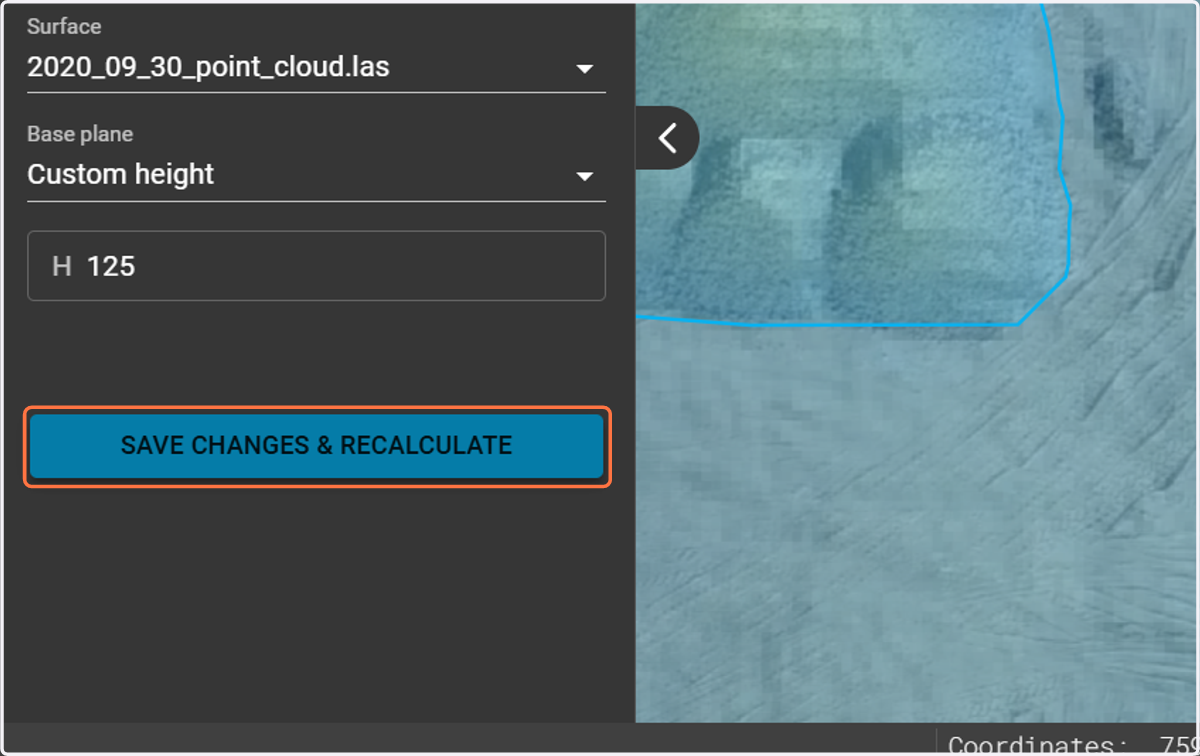
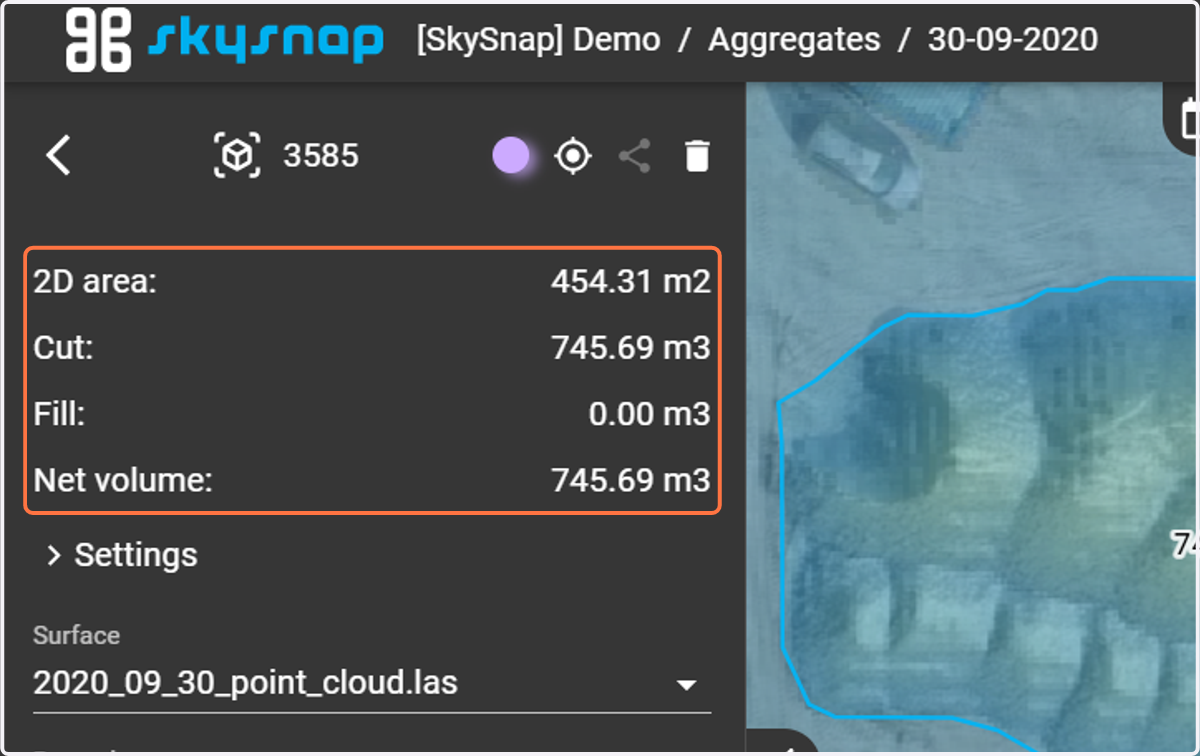
21. After pressing the "SAVE&CALCULATE" button, new values appear.
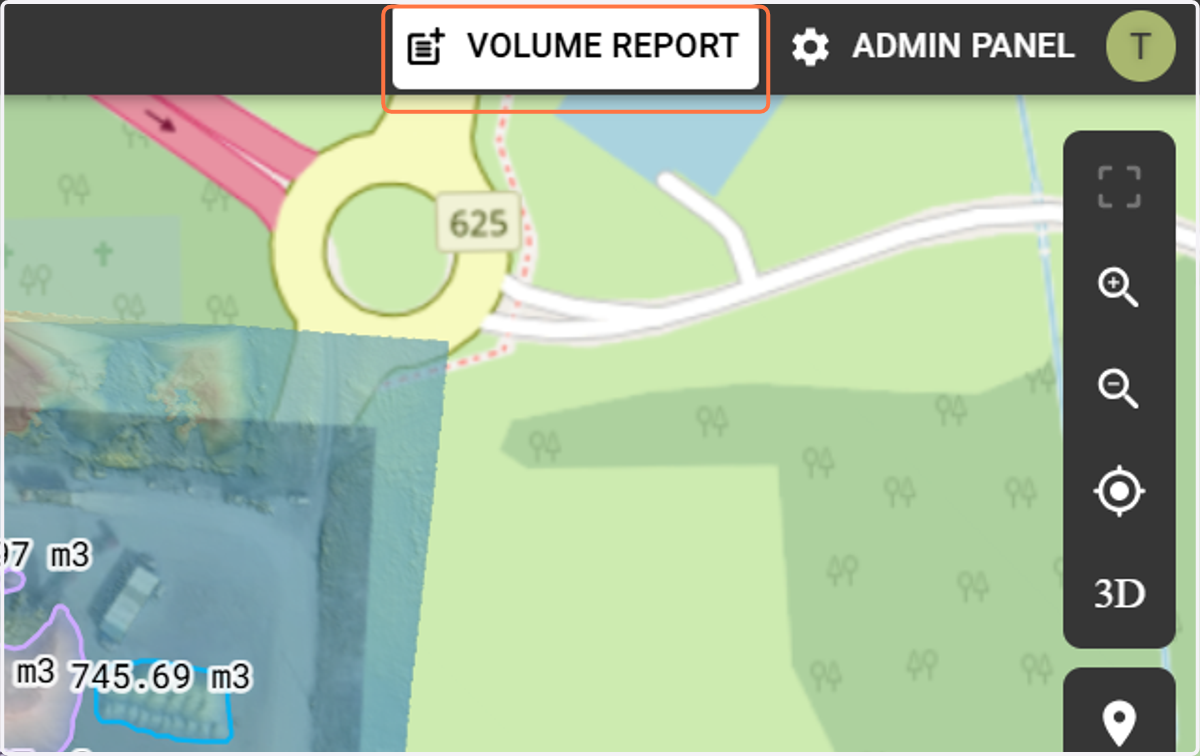
22. In the upper right corner there is a button "Volume report", after clicking it a report is generated and sent directly to user's email.
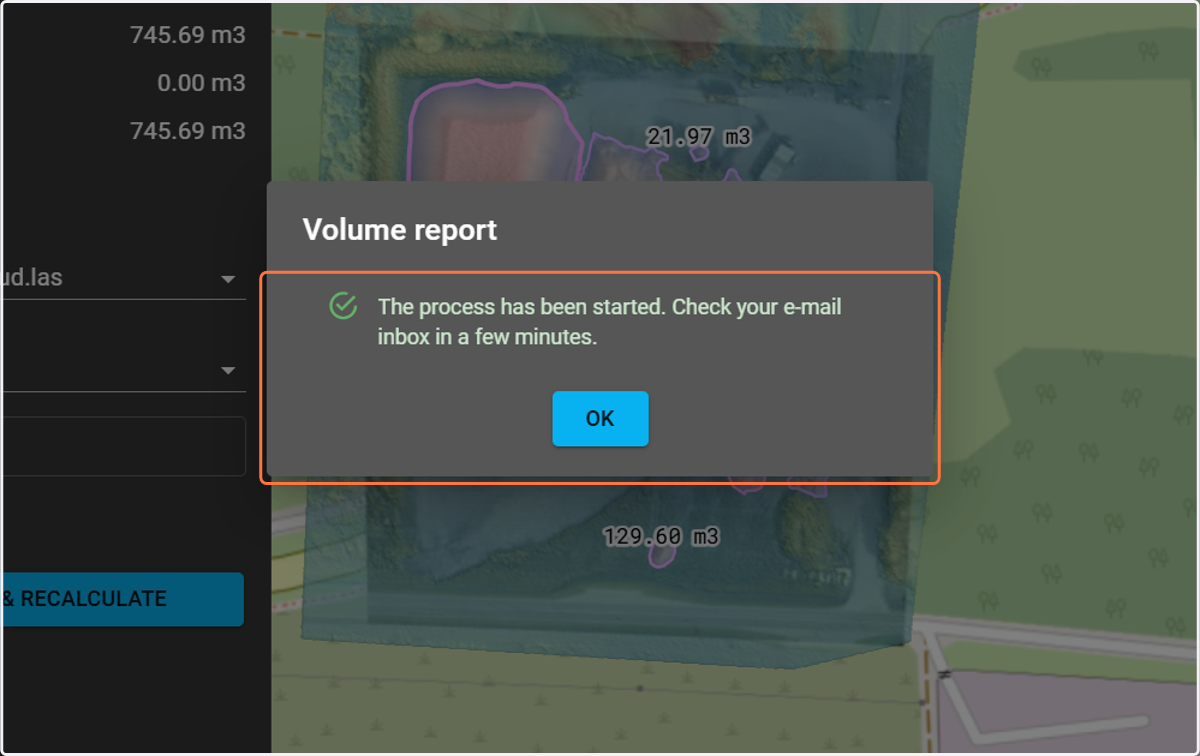
23. A window appears, informing you that the report generation process has started.
24. Example of a volume report.
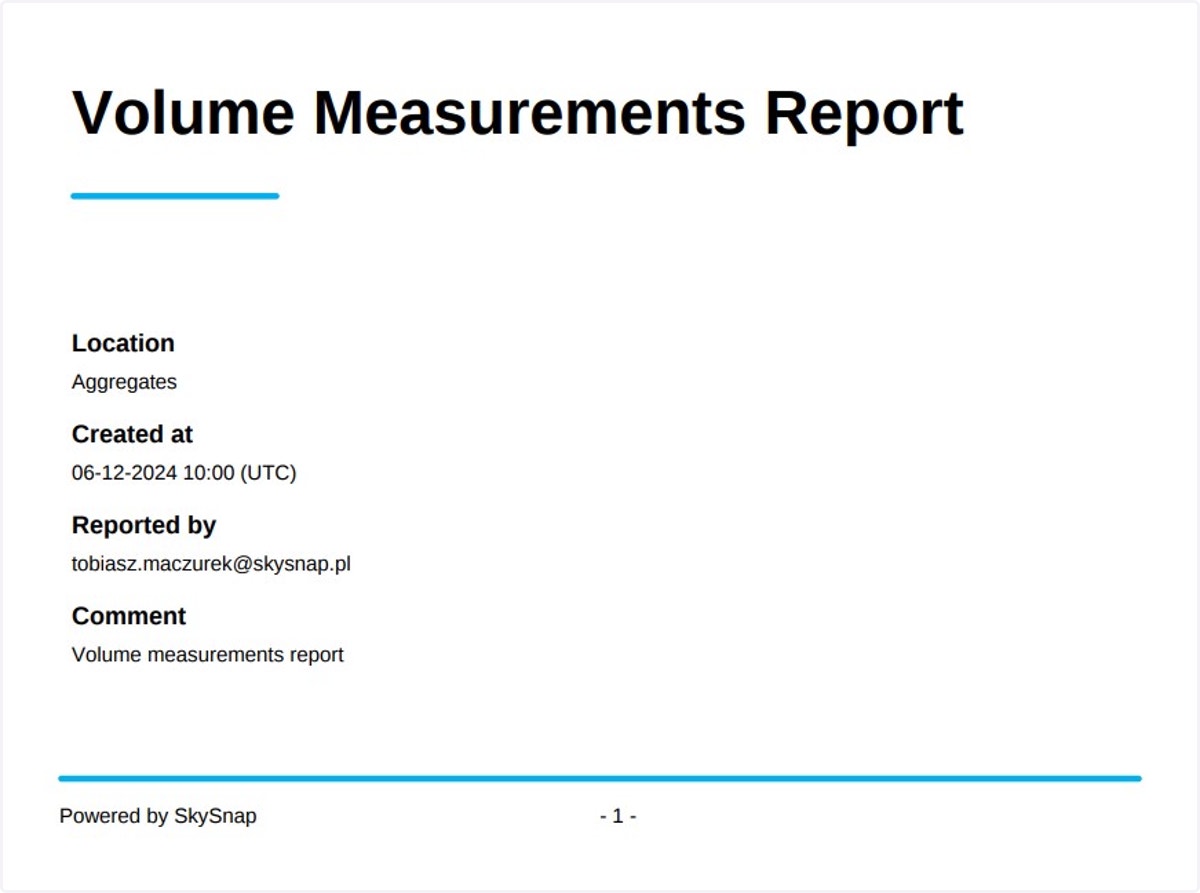
25. The report includes a map indicating the geometries of all surfaces for which volumes were counted.
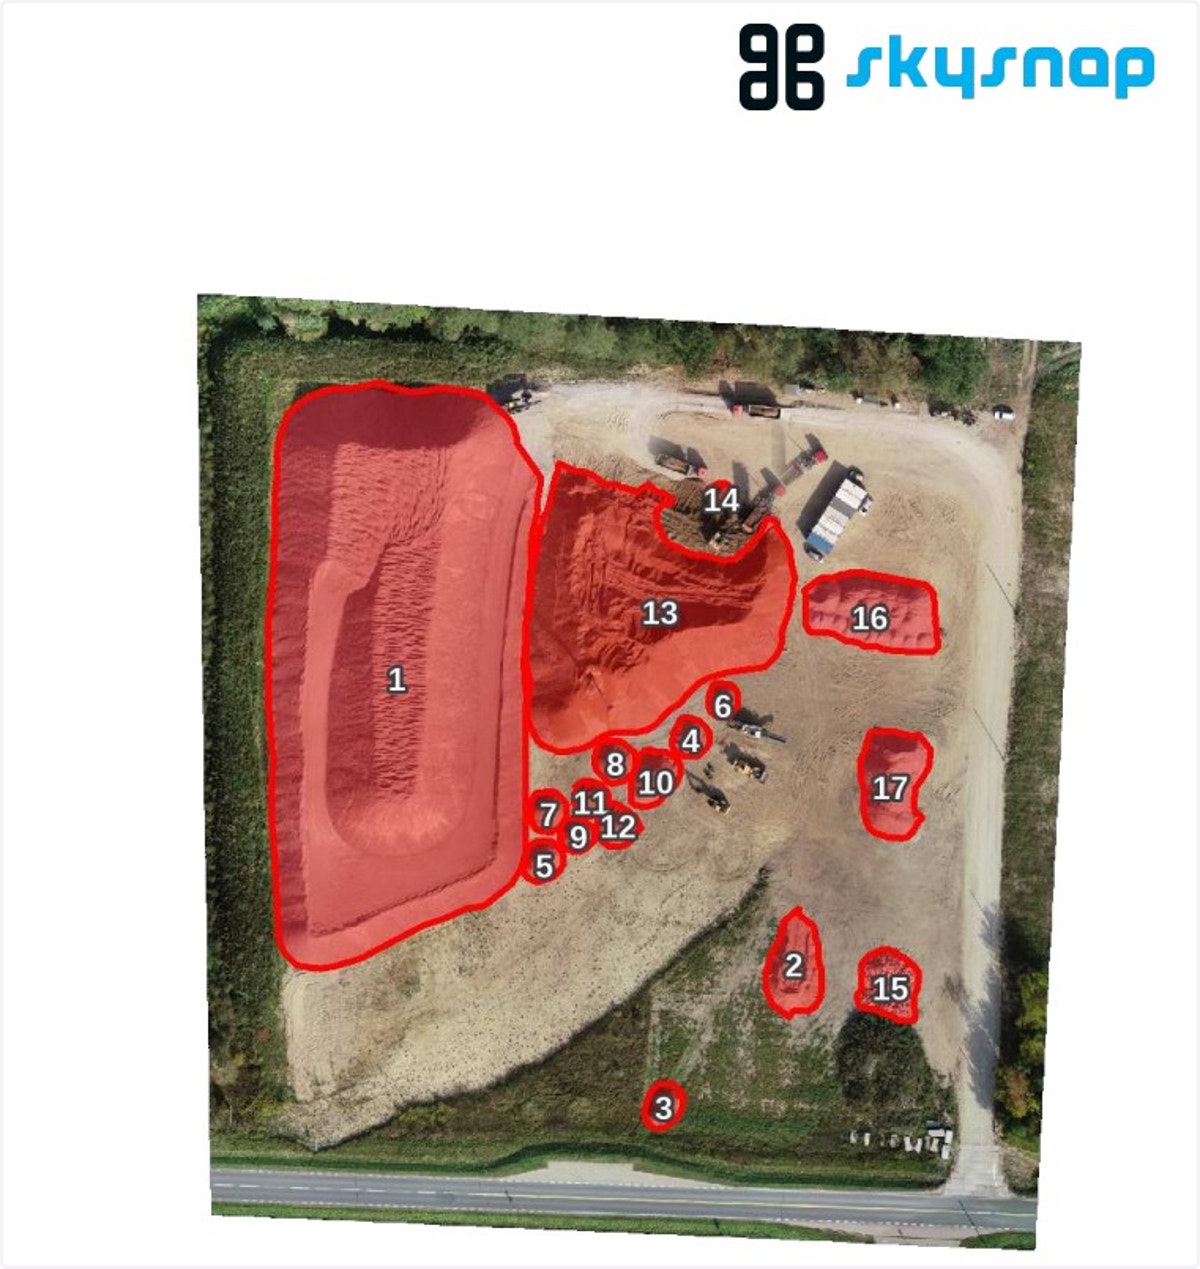
26. It also includes a table with all the volume results for each polygon.