Model Metrics
This page displays model performance metrics at training. This is for transparency to set pace for expectations and applications of the model results
1. How to access
This page can be accessed under the "Standard Evaluations" section
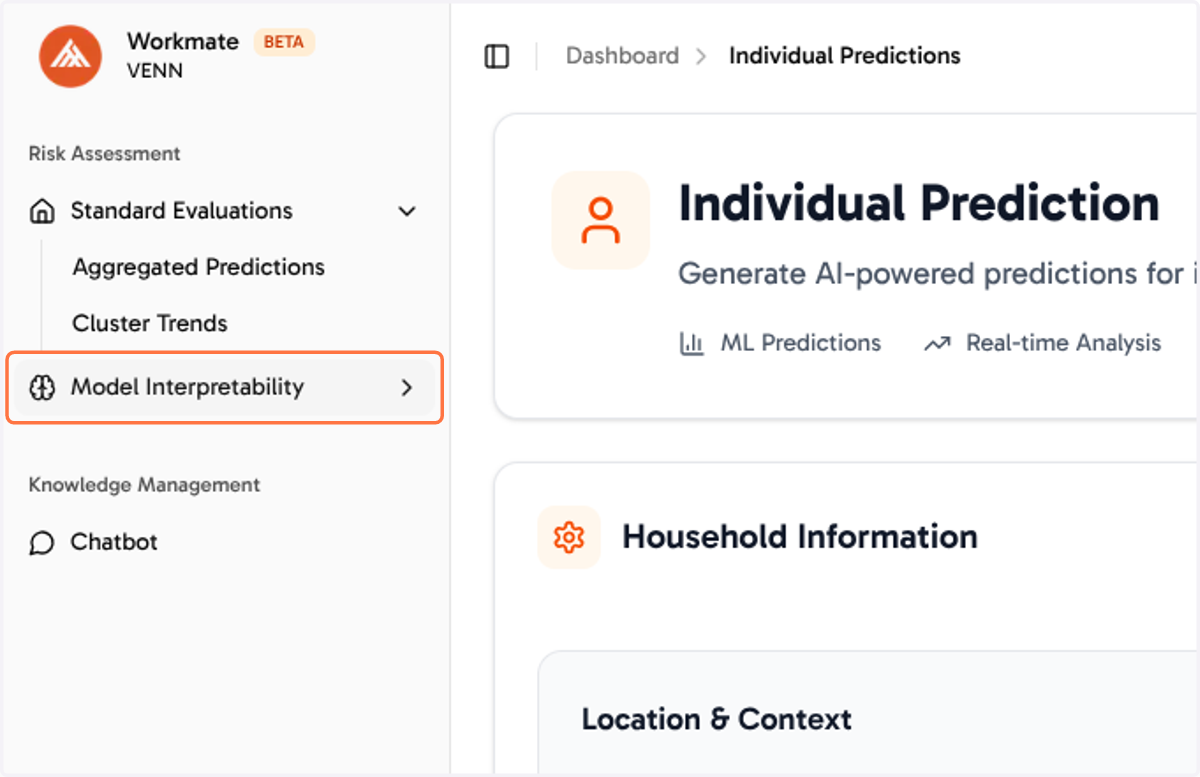
2. Click on Model Metrics
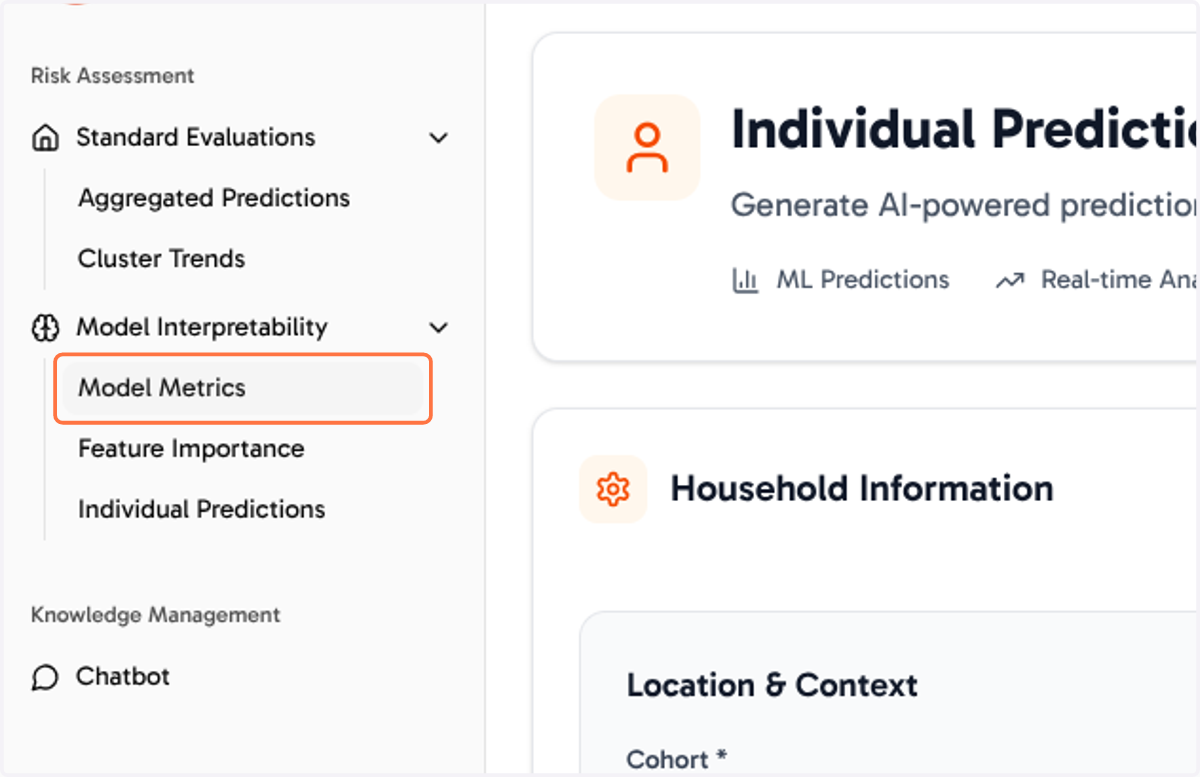
Workmate
3. Model Performance Summary
In this section, we can explore the various model performance metrics including for both Classification and Regression models.
Thes values lie between 0 and 1, with 0 lowest and pointing to weakness and 1 highest and pointing to maximum strength of the model in the quoted metric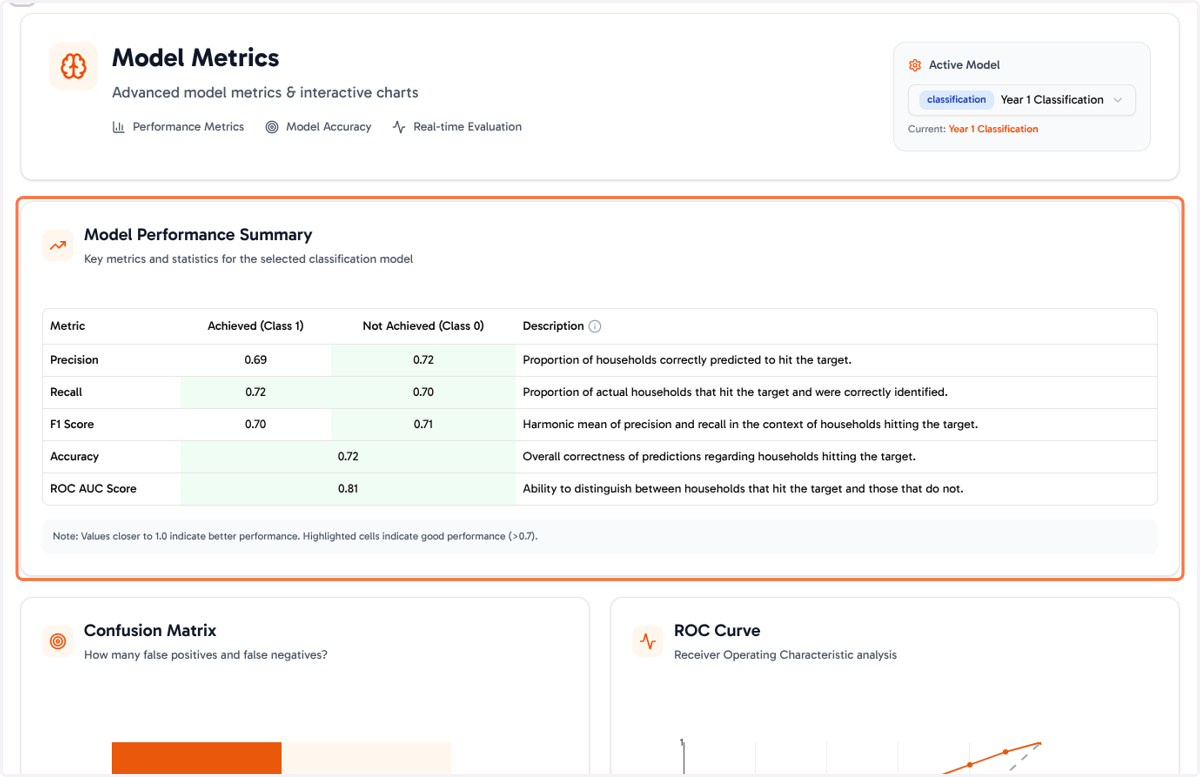
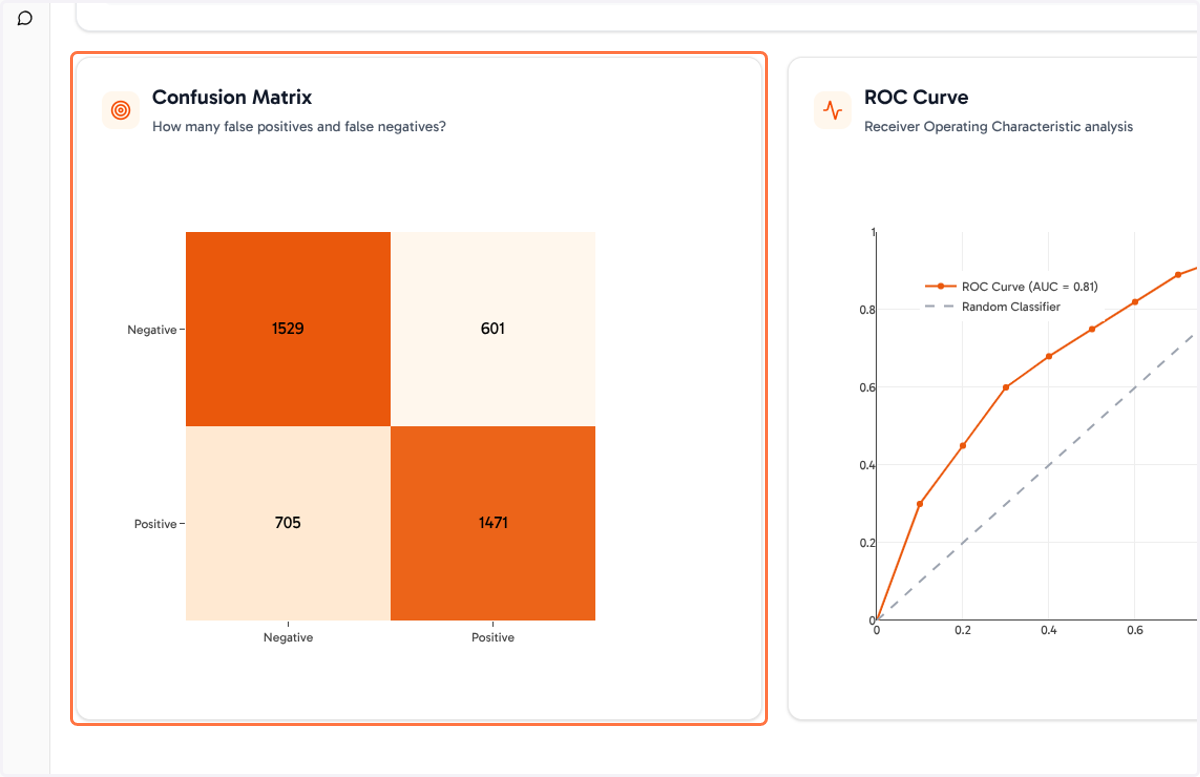
4. Confusion Matrix
The confusion matrix compares the model predictions vs the actual values, in this context, what the model predicted to hit or not to hit the target vs what actually hit or did not hit the target.
5. ROC Curve
The ROC Curve (applies for classification models) shows the model's ability to distinguish between households that hit the target and those that did not.
This value lies between 0 and 1, with 0 meaning the can't completely distinguish, and 1 saying the model can perfectly distinguish between households that hit the target from those that did not.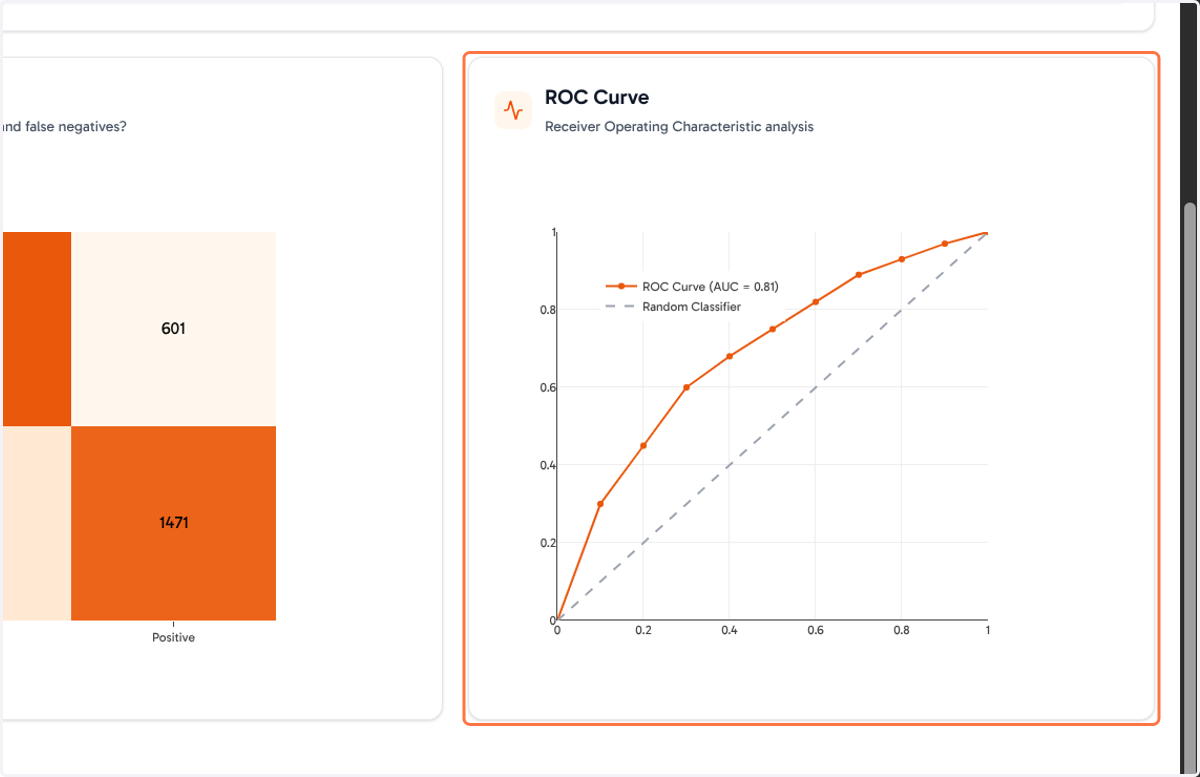
6. Switch between Regression and Classification Models
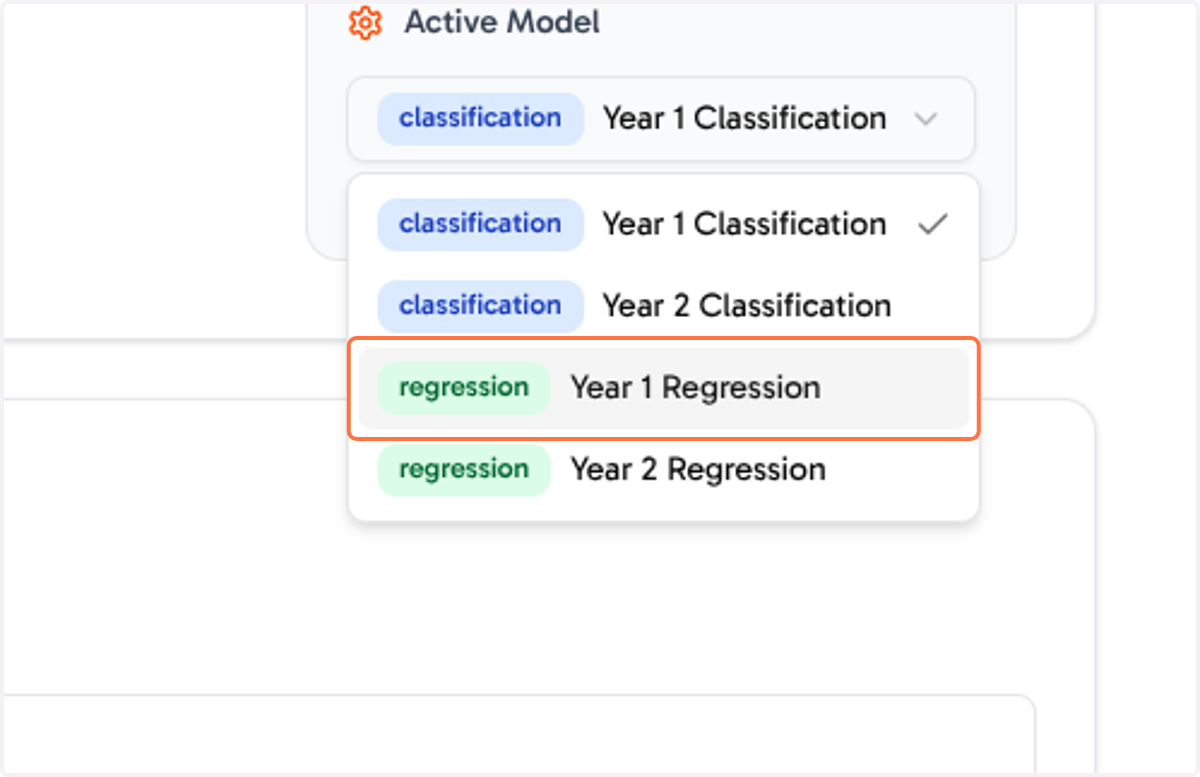
We can switch between the various classification and regression models using the drop down on the top right corner labled "Active Model".