Predictions Dashboard
Workmate Predictions Dashboard
After logging in, if you're a Superuser or Area Manager, you will be redirected to the Predictions Dashboard. This is the place where you can analyse the predicted performance basing on various data collected in the Standard Evaluation Surveys
1. Aggregated Smart Filters
You can be able to filter Aggregated Predictions by Cohort, Cycle, Region, District, Cluster and Evaluation.
You can also download your data for further analysis by using the "Download CSV" button.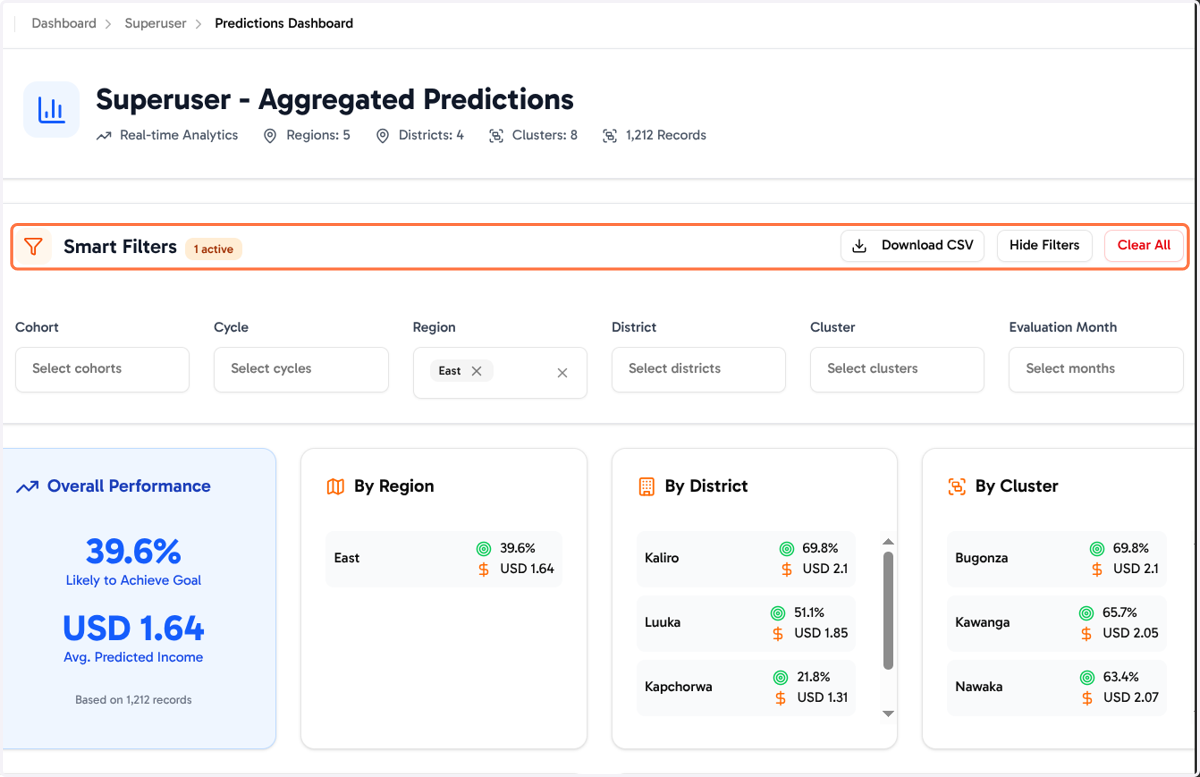
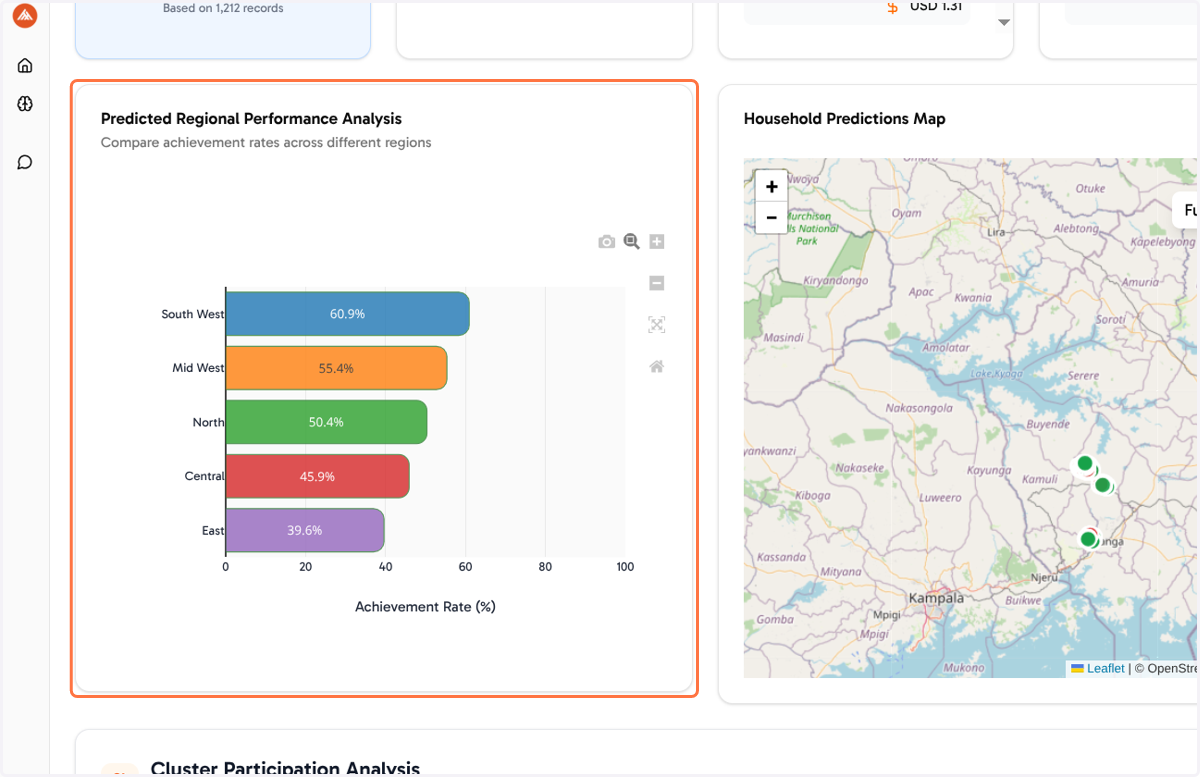
2. Regional Performance Analysis
You can compare how different regions are performing through a bar chart
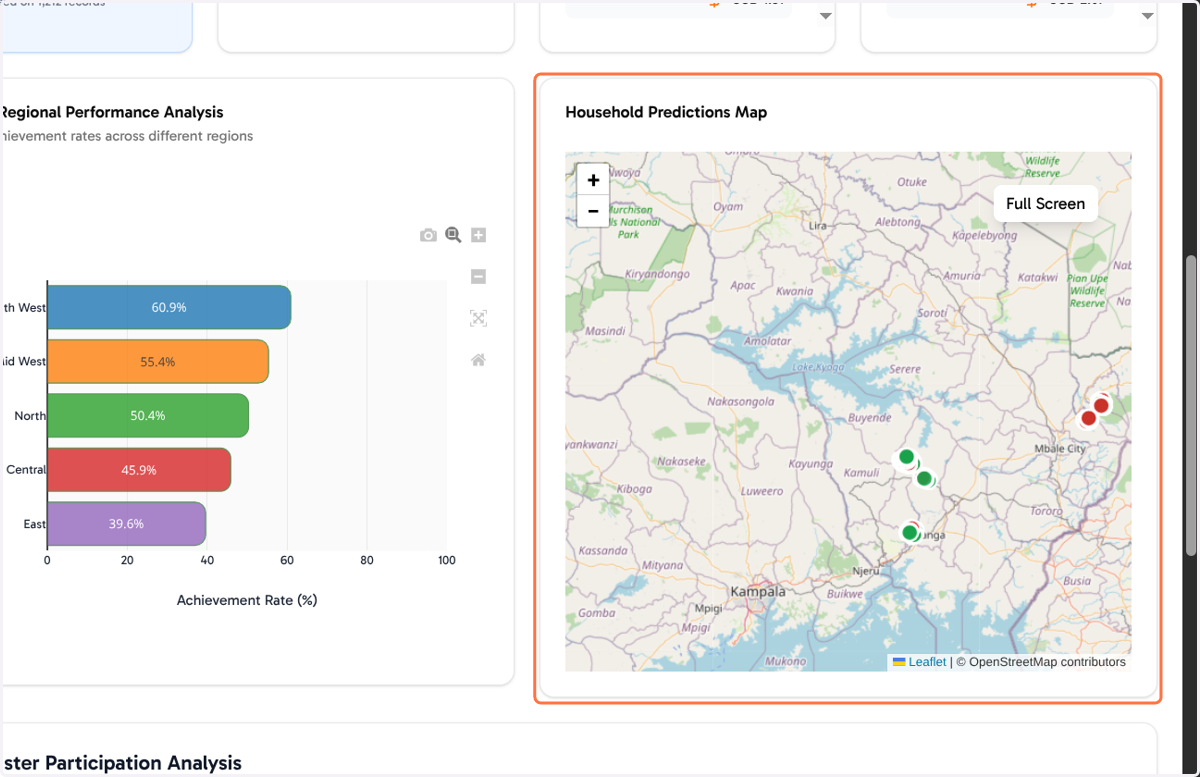
3. Household Predictions Map
You can also explore specific households from the data. Note that only households satisfying the applied filters will be displayed on the map
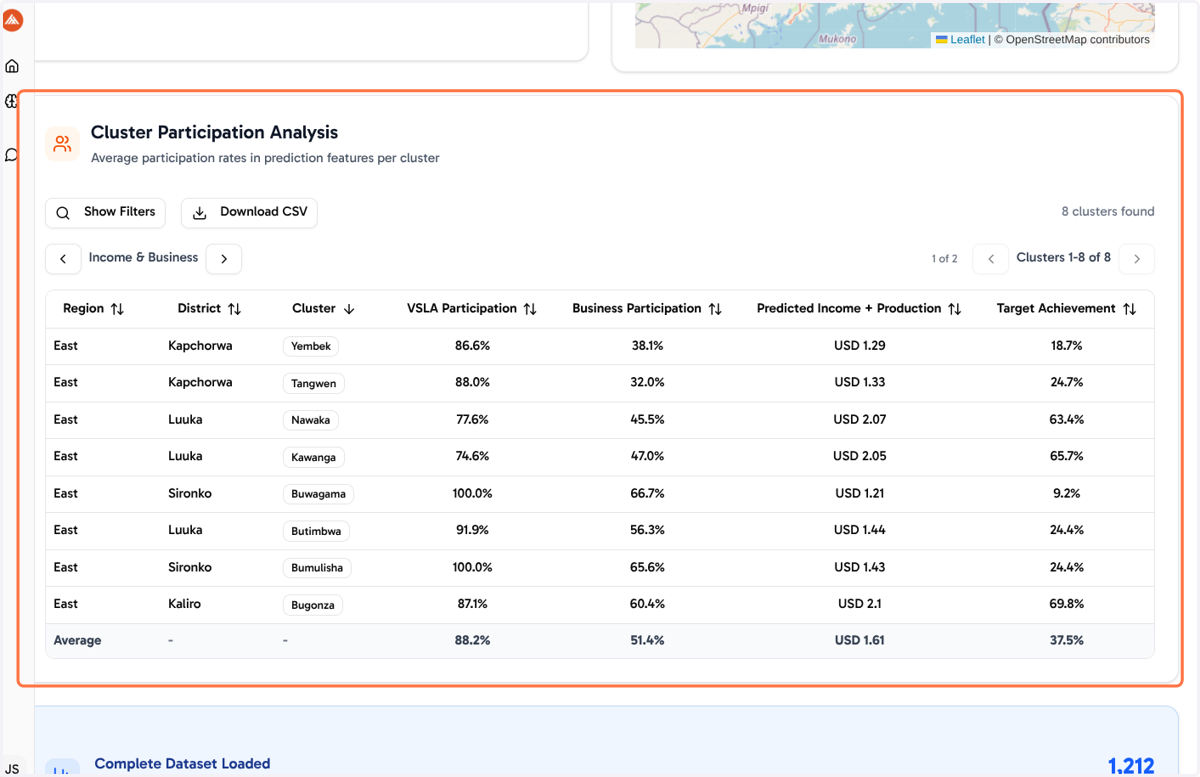
4. Cluster Participation Analysis
We can explore how clusters are performing in the various features that we are using for making predictions