Cluster Trends
The cluster trends page allows us to track the performance of the clusters at the various evalution periods, this includes percentage predicted to hit their target, and then the predicted income. These values are aggregated from individual predictions to cluster level.
Workmate Cluster Trends
The cluster trends page can be accessed under the "Standard Evaluations" sections on the side bar.
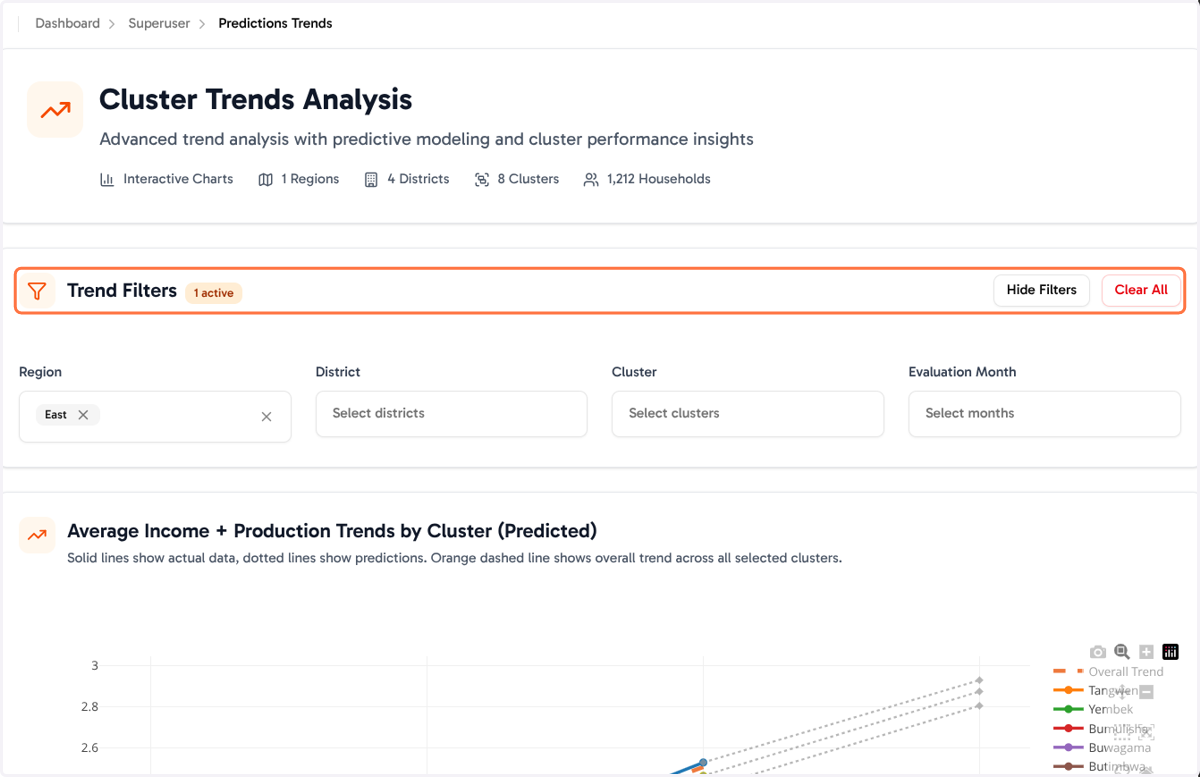
1. Trend Filters
You can be able to filter the trends data by using the smart filters, you can filter by region, district, cluster and then evaluation month.
2. Average Income + Production Trends chart
This chart illustrates the trends of the clusters in the filtered data.
Solid lines show actual predicted data, dotted lines show projections based on available predictions.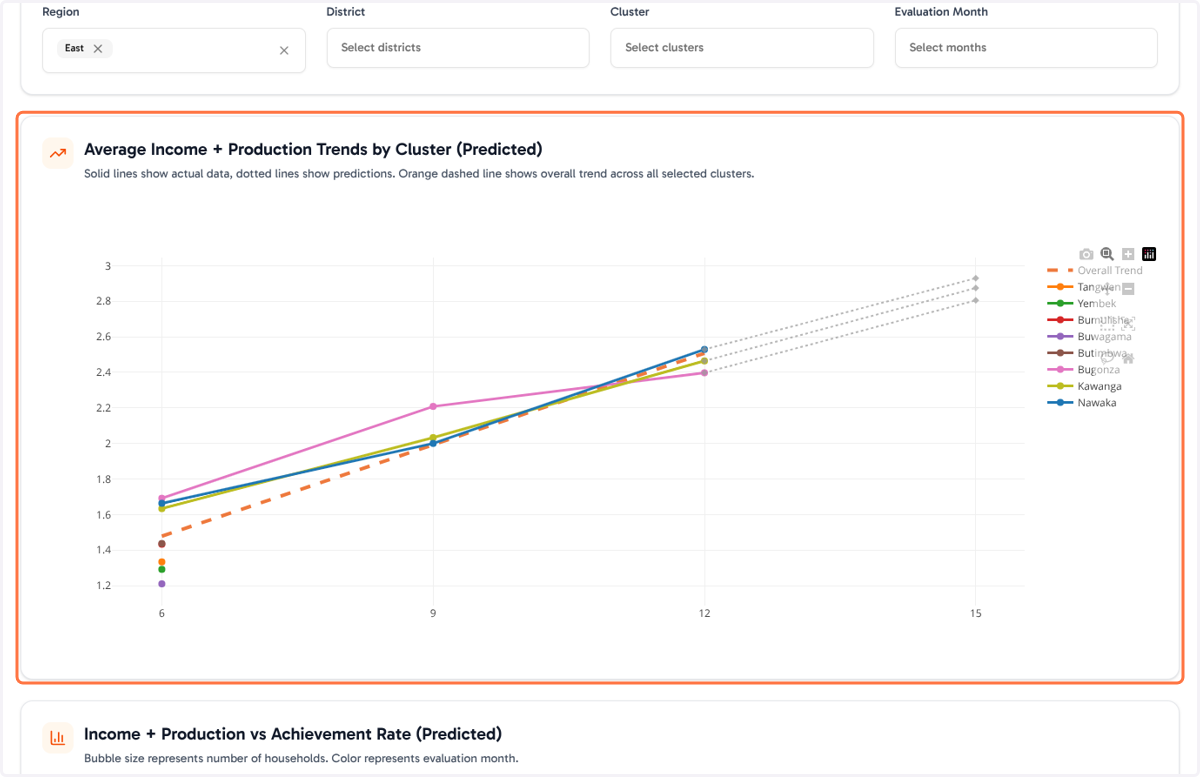
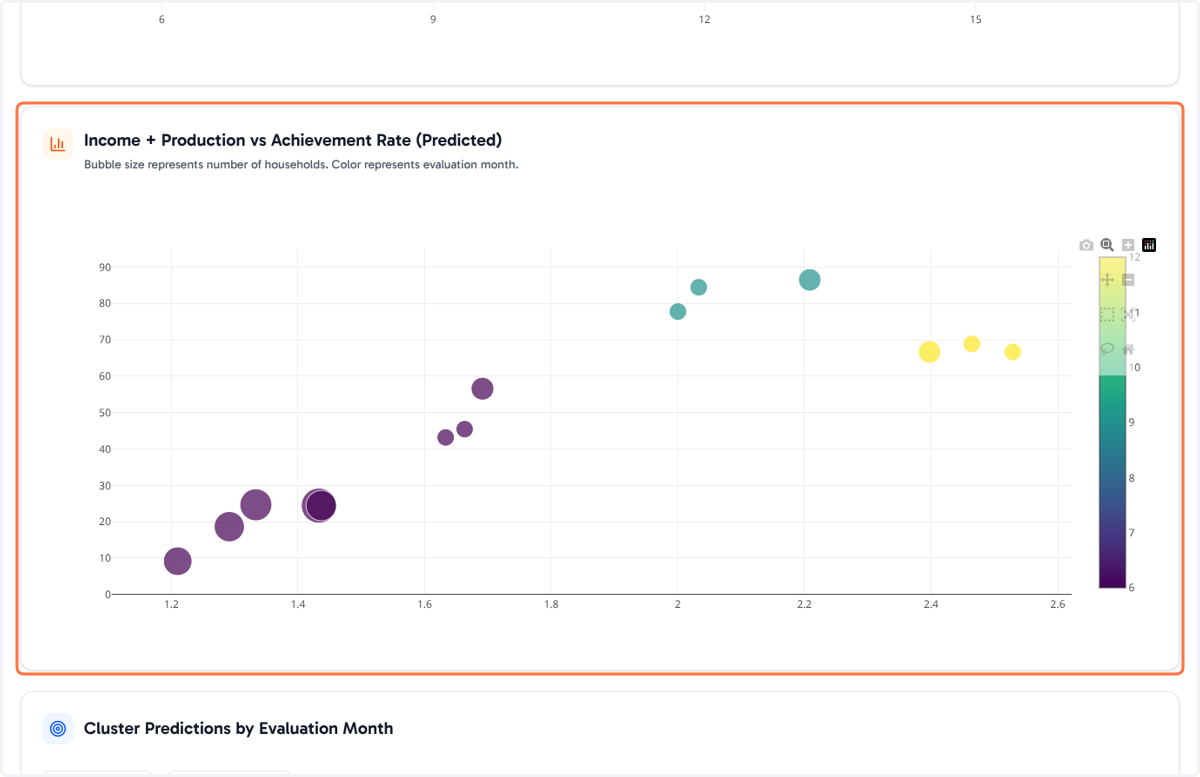
3. Income + Production vs Achievement Rate (Bubble chart)
The bubble chart also visualizes trends in a unique way, providing context on the numbers used for the prediction (in the size of the bubble)
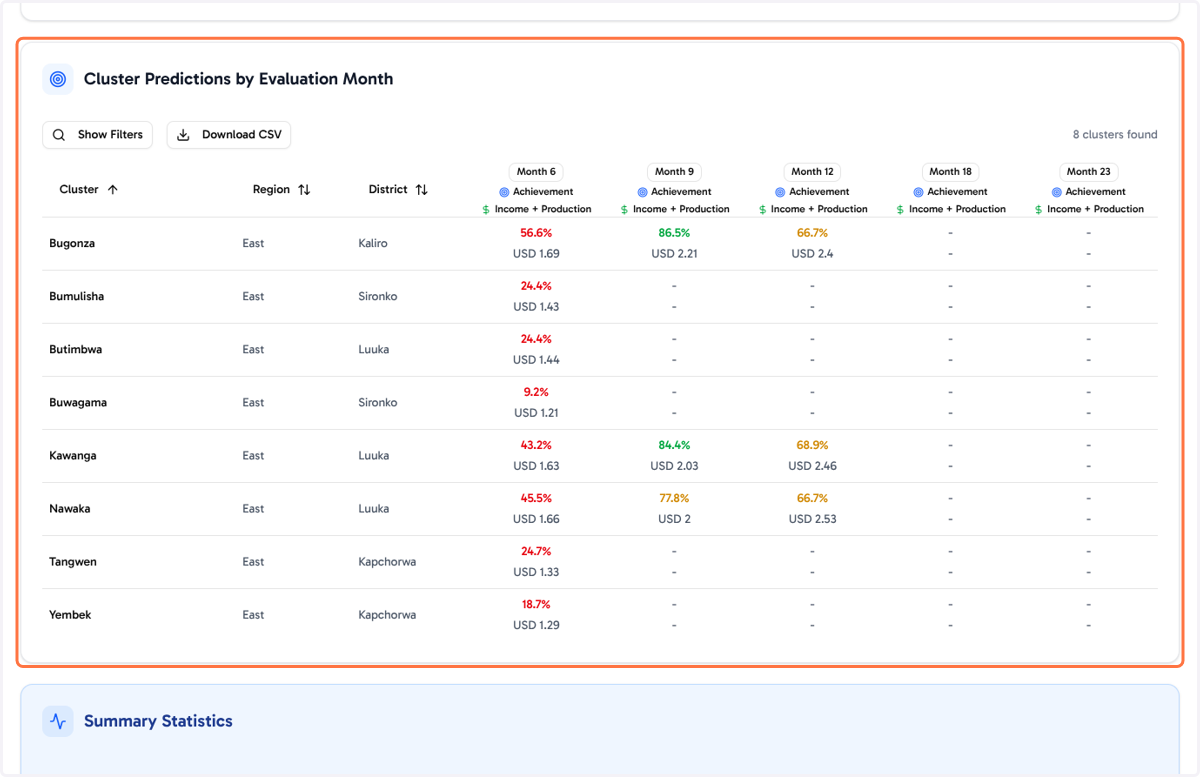
4. Prediction Trends by Evaluation Month
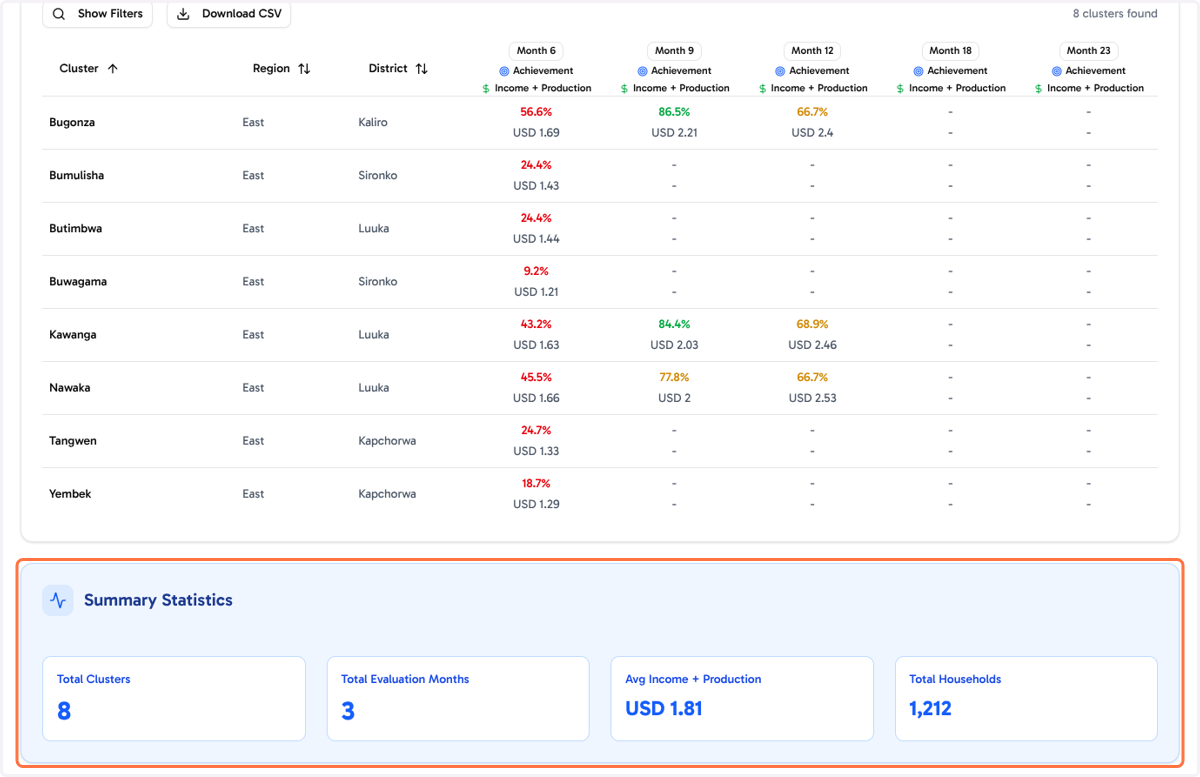
The table shows how particular clusters (according to filters applied) have progressed accross the evaluation months, also clearly stating the prediction percentage to hit the target and the predicted income.
5. Summary Statistics
The summary statistics card shows some summaries of the data on the page. These include the total clusters, evaluation months, predicted Income + Production and the total households as a from the filters.