Predict Program Size - User Guide
Predict Program Size - 2024 Update - New Programs | Sheet
This guide will cover the Predict Program Size section of this app. For instructions on how to use the Pro Forma capabilities, or the Build or Buy tool please see our other guides.
All numbers in this guide are illustrative.
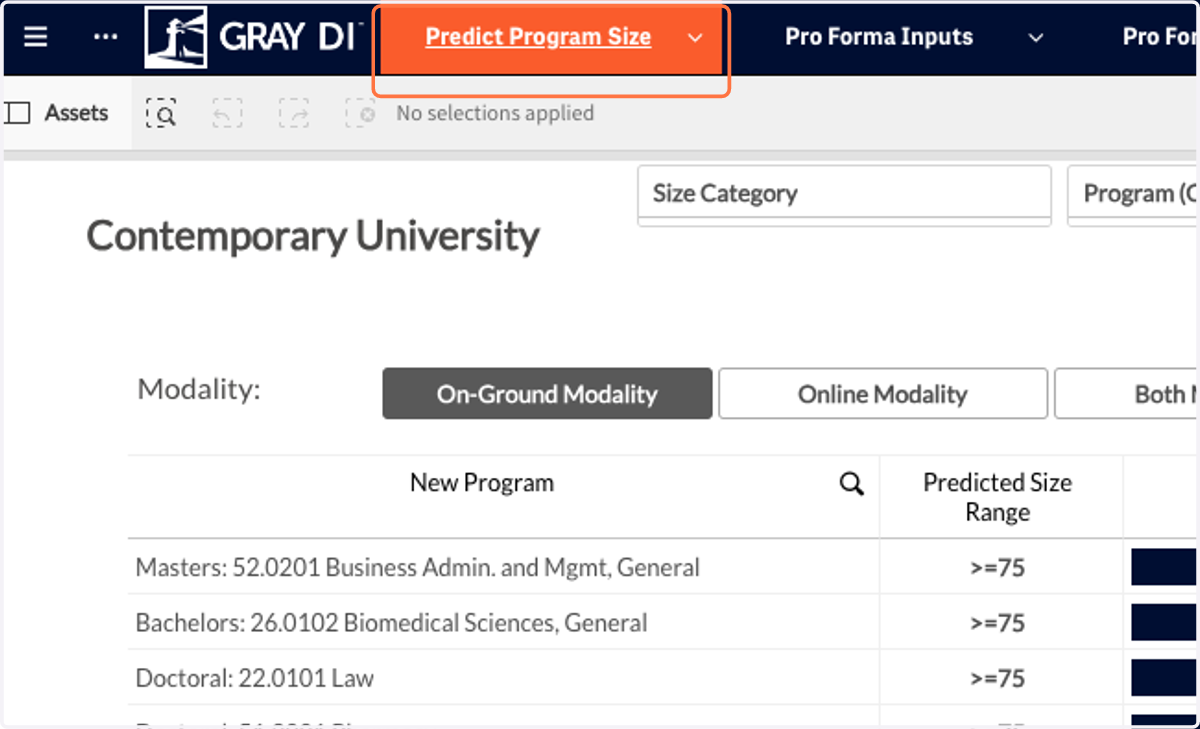
1. Start by opening the Predict Program Size menu.
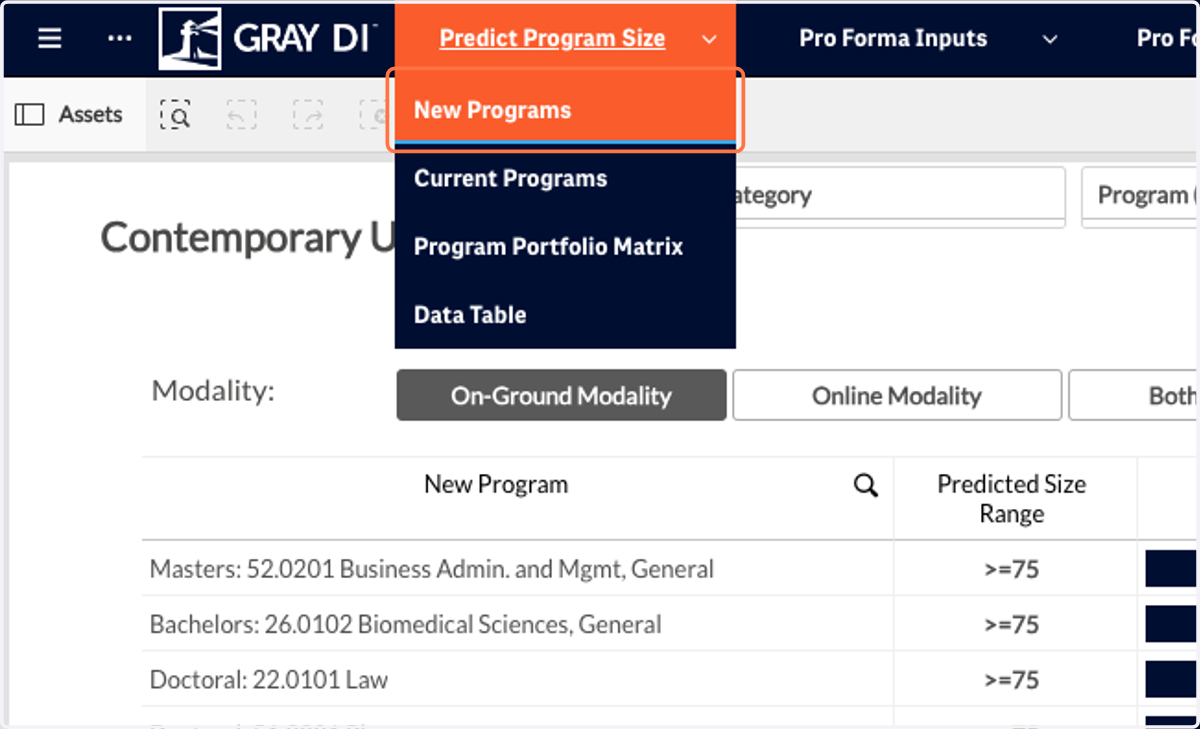
2. Click on New Programs to open the New Programs sheet.
You can use this app to review your current portfolio or search for new program opportunities.
3. The New Programs sheet provides you with predictions and competitive information on potential new programs.
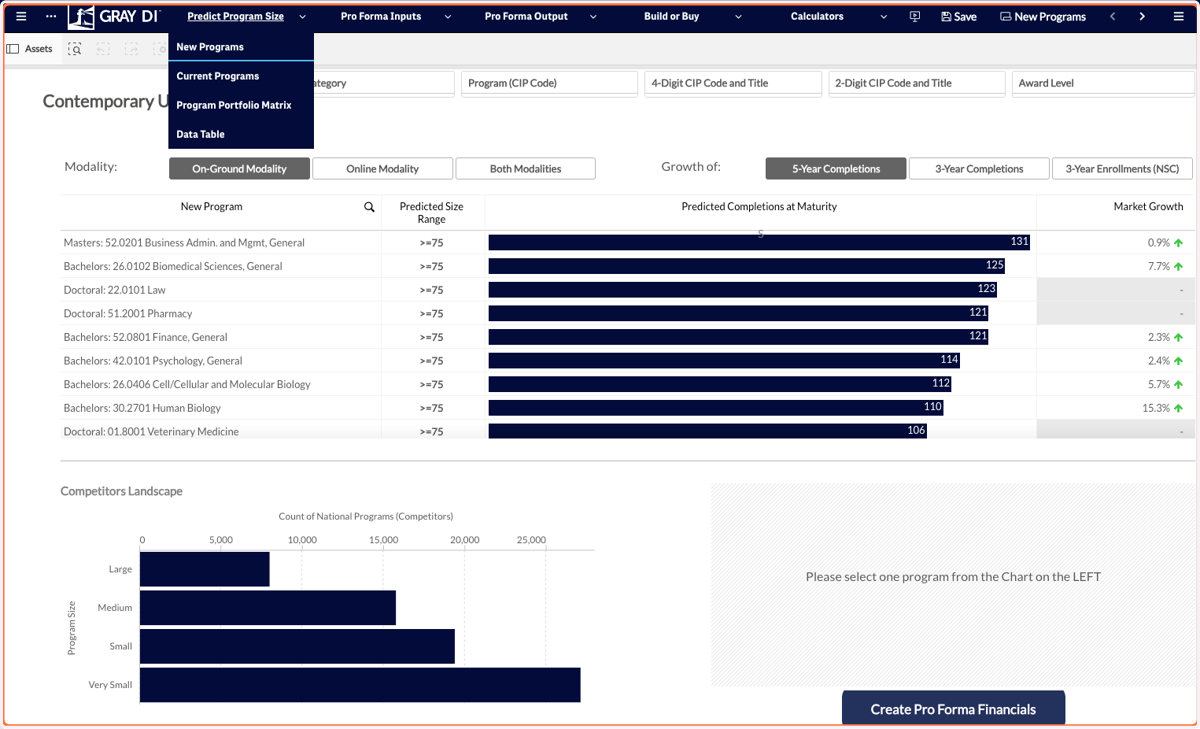
4. You can toggle by modality to see different predictions based on the type of program you are interested in.
Modality refers to the predominant modality. For example, if you select Online Modality, it indicates that your program will be offered mostly online.
Note: Both Modalities indicate that both an online and an on-ground option will be offered, not that this will be a hybrid program.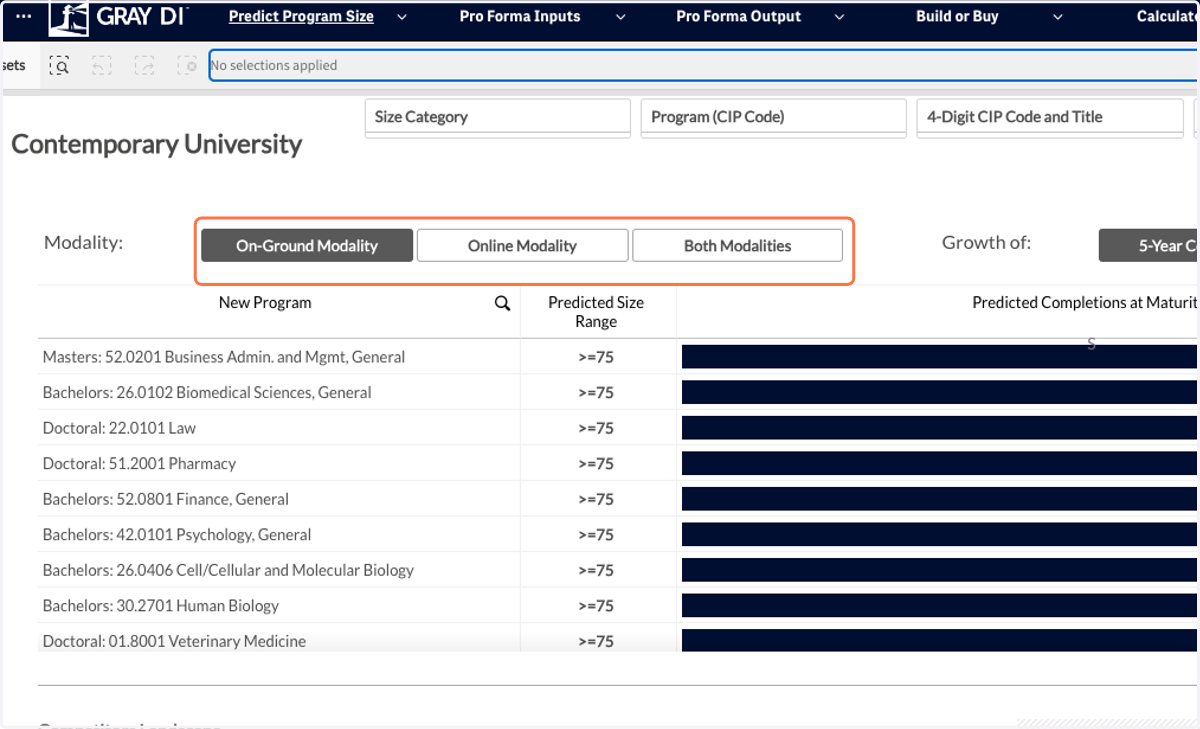
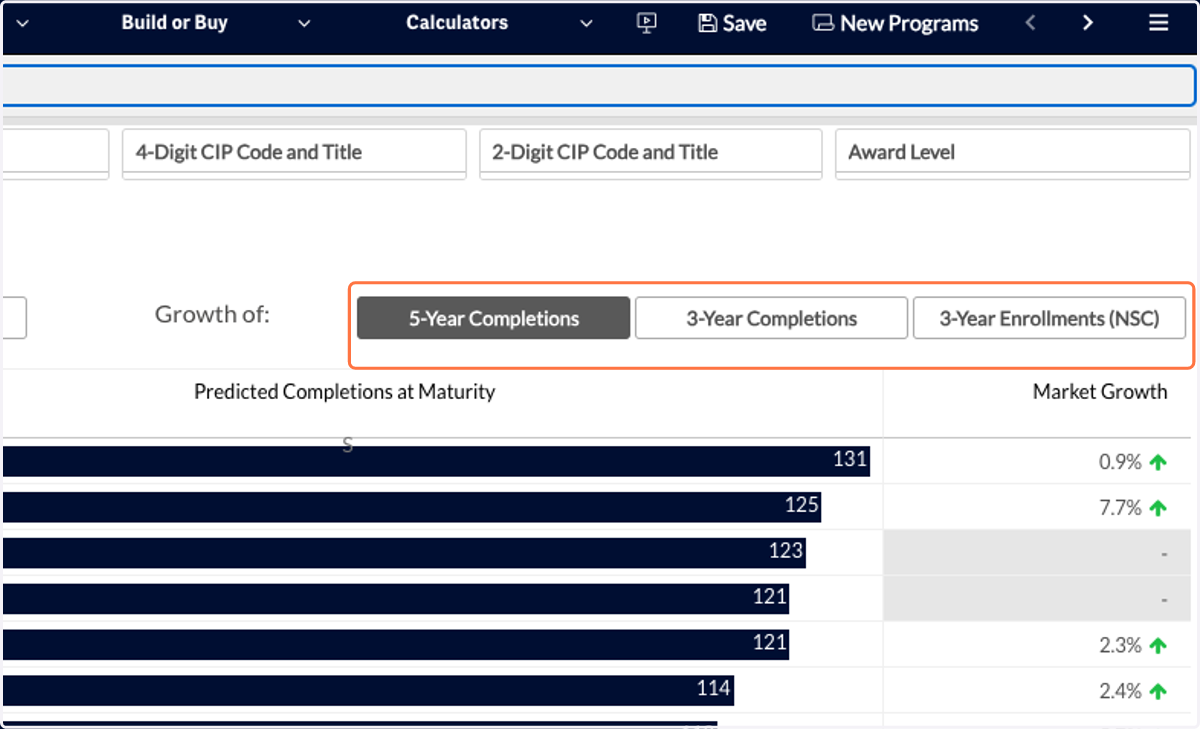
5. You can also toggle between various growth metrics to understand the changing student demand for each program.
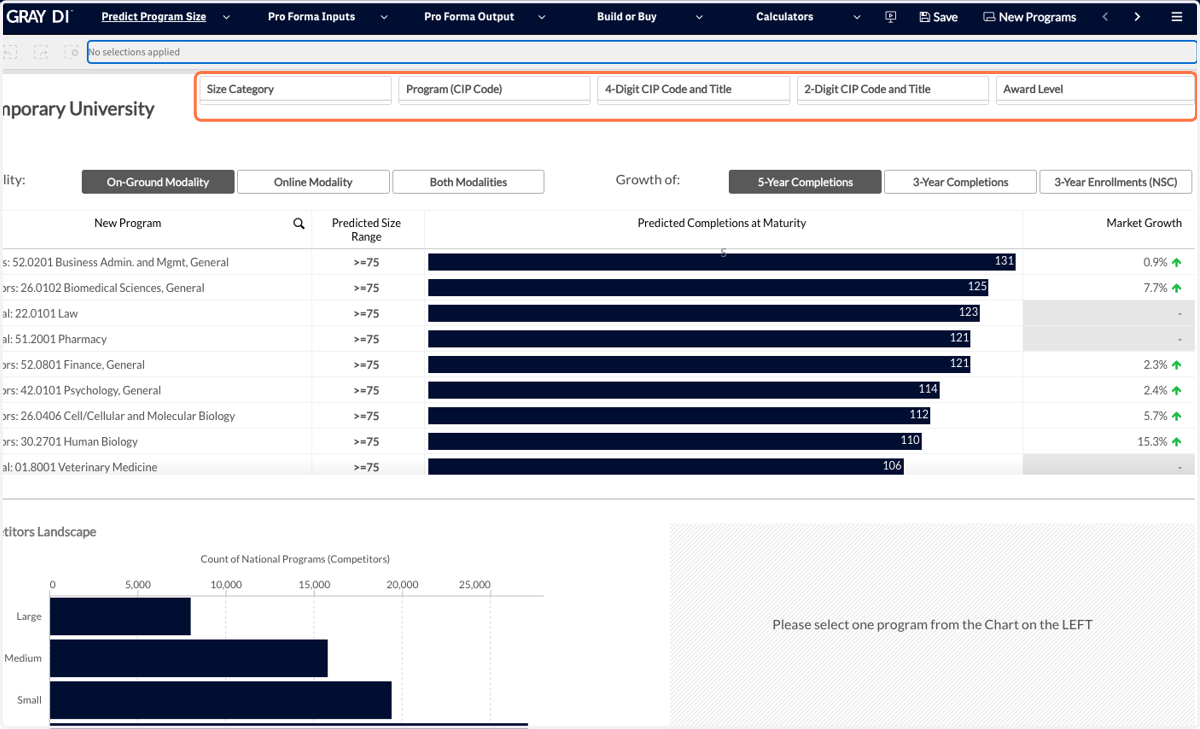
6. You can filter the programs by Size, CIP code, or Award Level in order to narrow down your search.
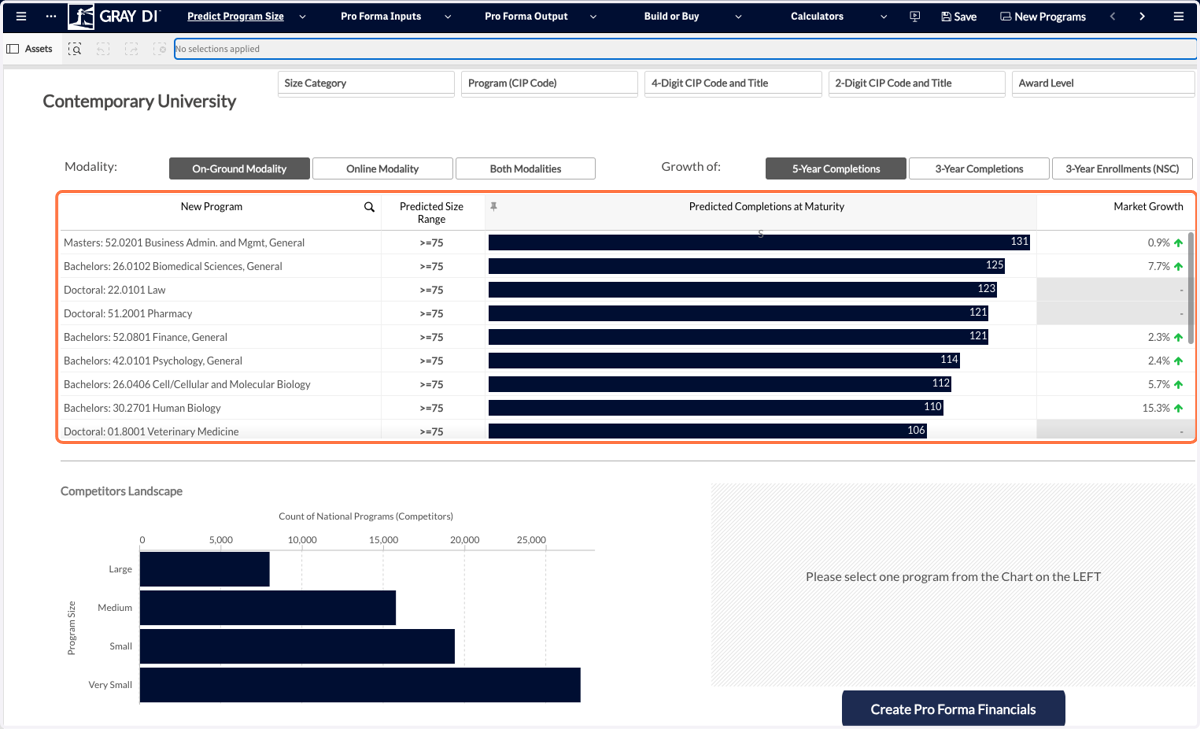
7. The table in the center of your screen provides the predicted size of each program at your institution, as well as the growth in your selected metric.
Note: the model predicts completions at maturity. Maturity is defined as the third cohort.
8. To select a program click on the program name in the table.
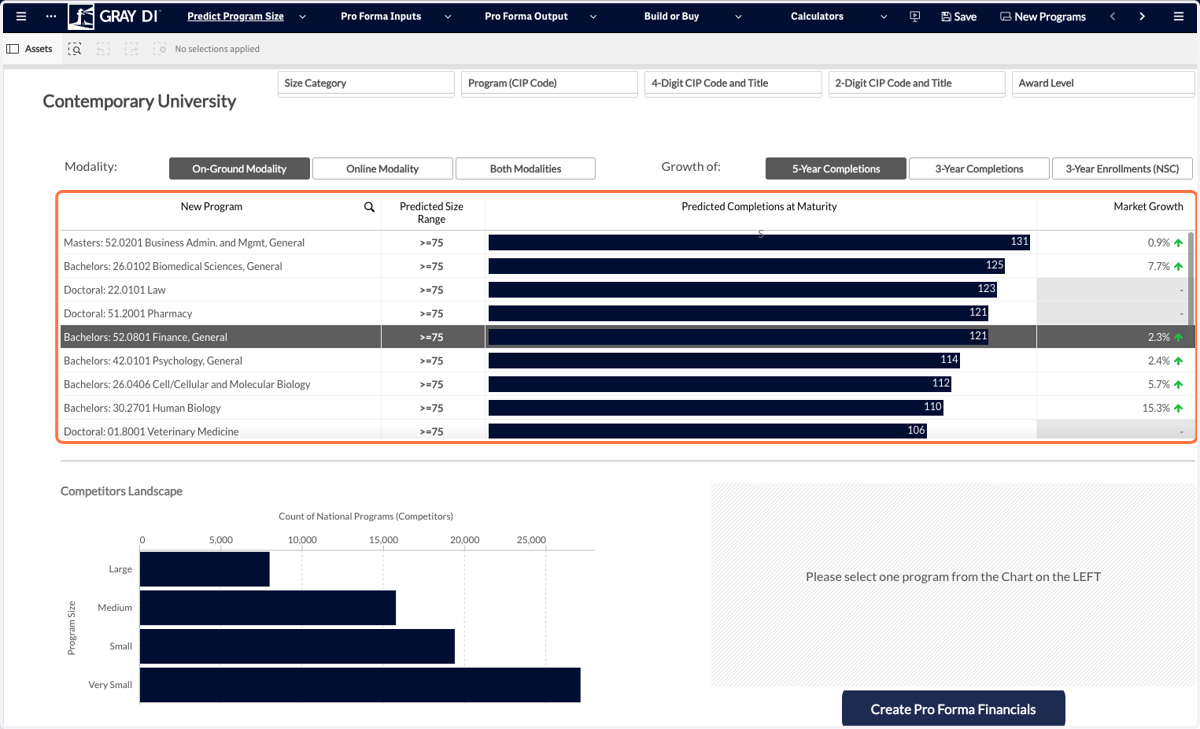
9. Click on the check mark to confirm your selection.
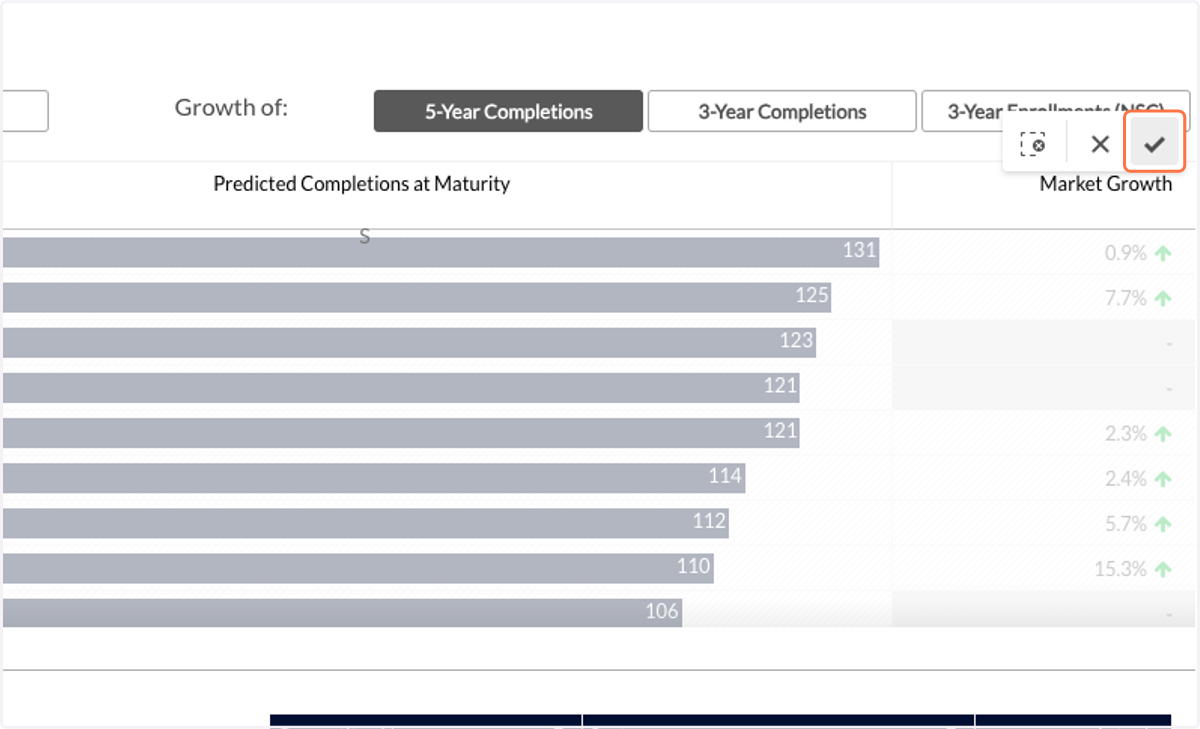
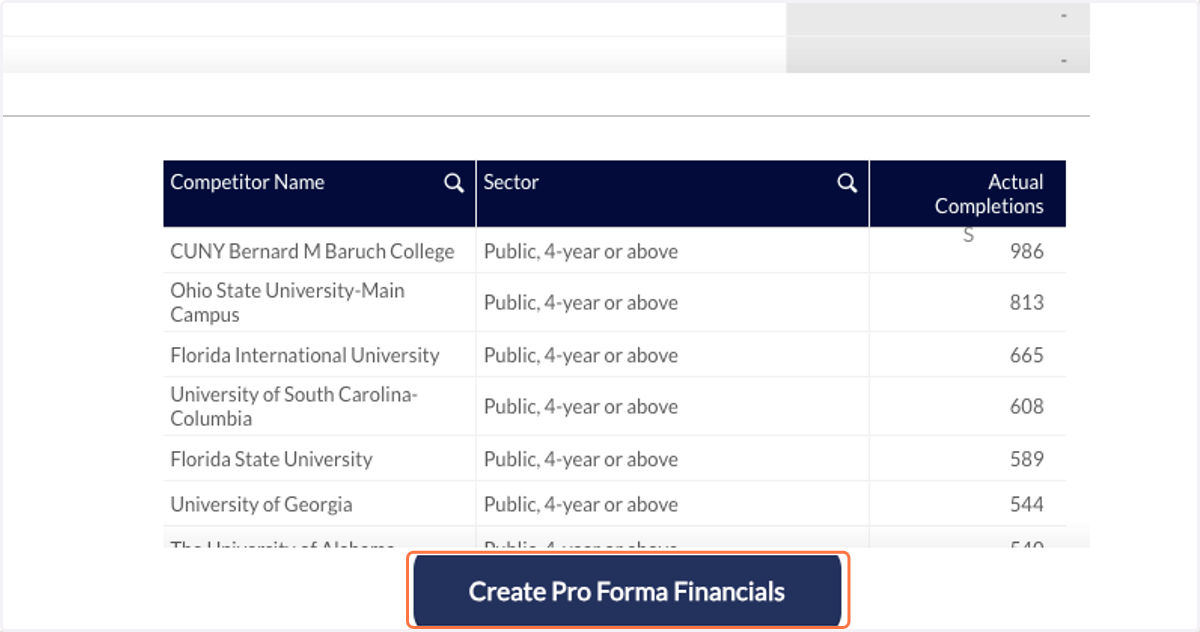
10. Once you select a program, you will see a table of competitors for this program.
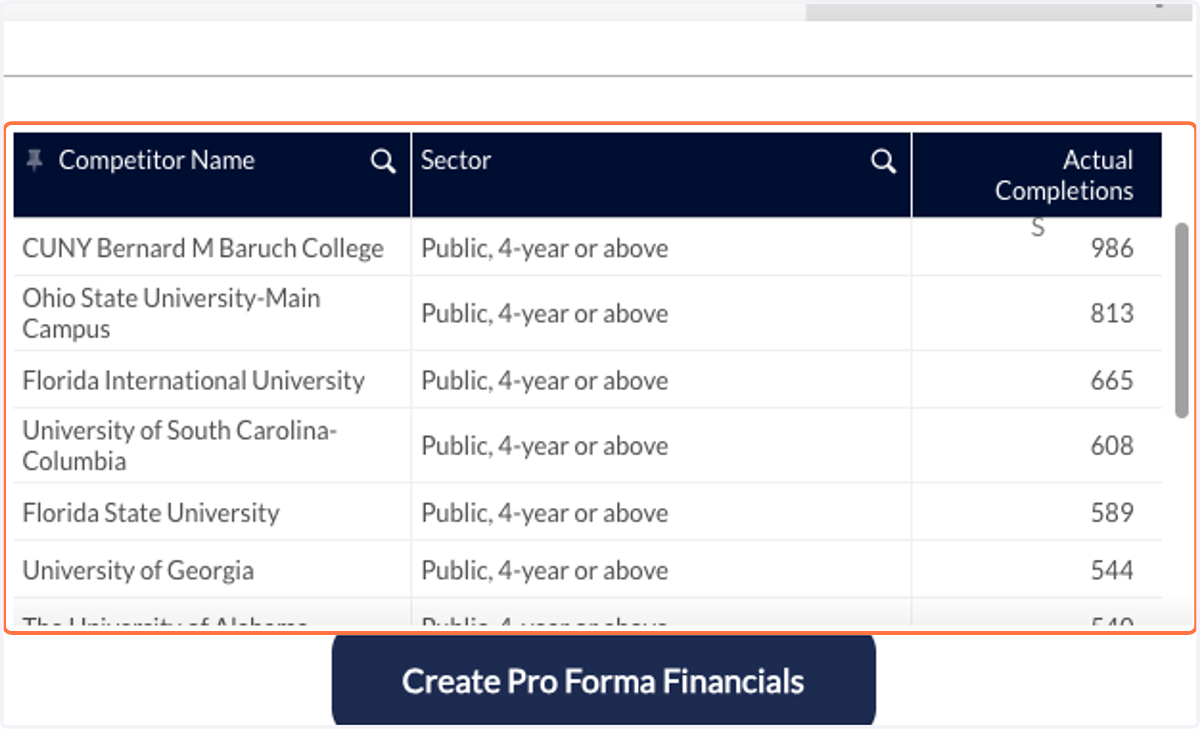
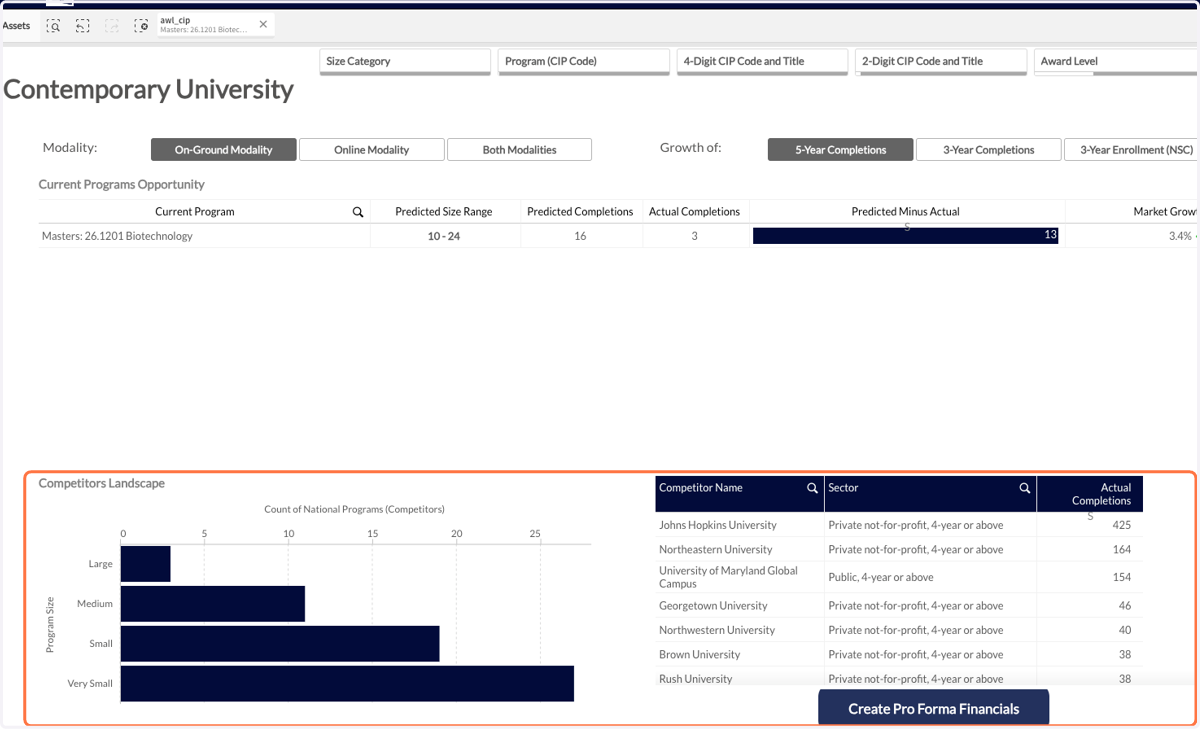
11. You can also see a breakdown of the competitive landscape for this program broken down by program size.
Large: >= 75 Completions
Medium: 25 - 74 Completions
Small: 10 - 24 Completions
Very Small < 10 Completions
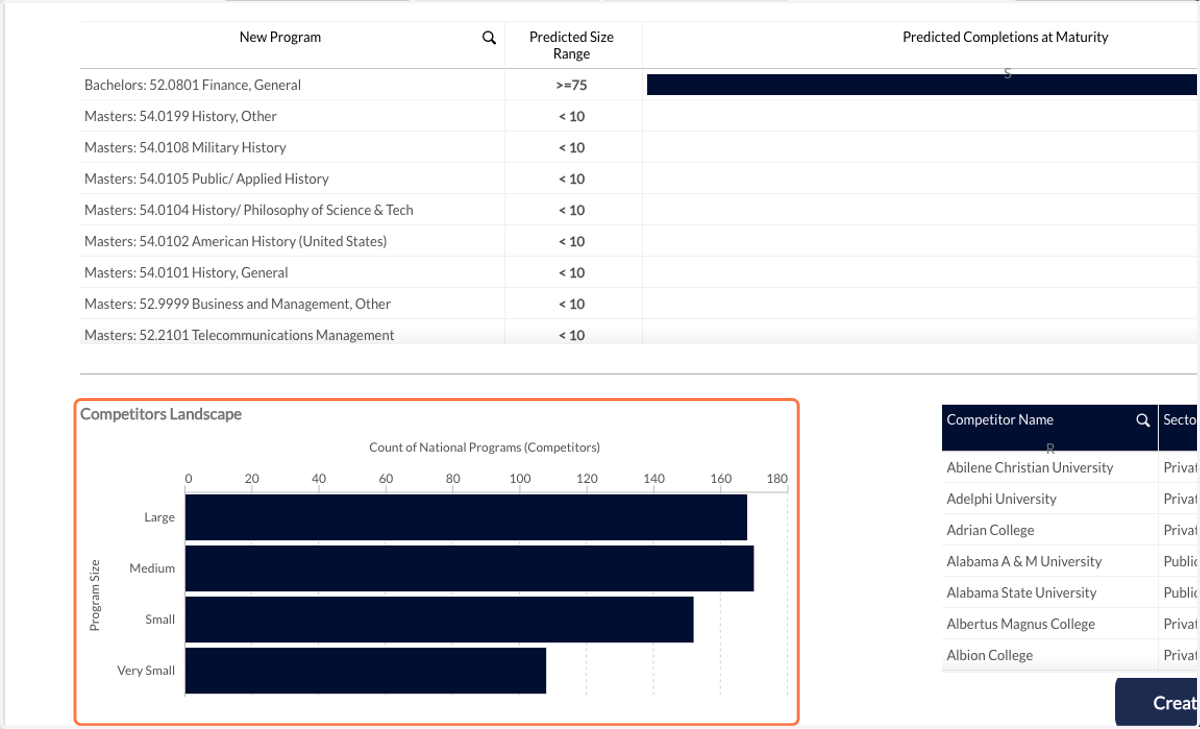
12. You can click on the Create Pro Forma Financials button to move on and create a financial model for this program.
For instructions on how to use the pro forma portion of the app, please see our other user guide.
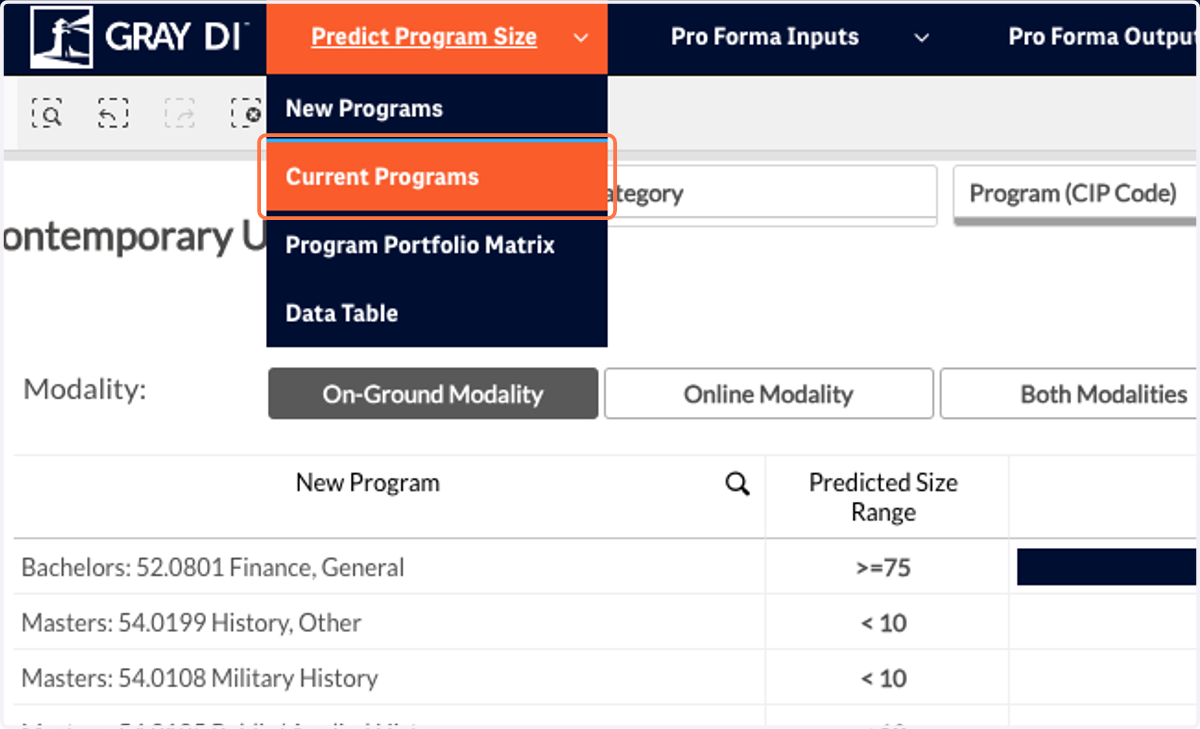
13. To navigate to the Current Programs sheet use the drop-down menu at the top of your screen and click on the Current Programs button.
14. The Current Programs sheet shows you similar information about your current portfolio of programs, including your actual reported completions.
Note: If you do not see one of your current programs on this sheet, you can find them on the New Programs sheet. If you have not yet reported 3 years of non-zero completions, the model will still consider it a new program.
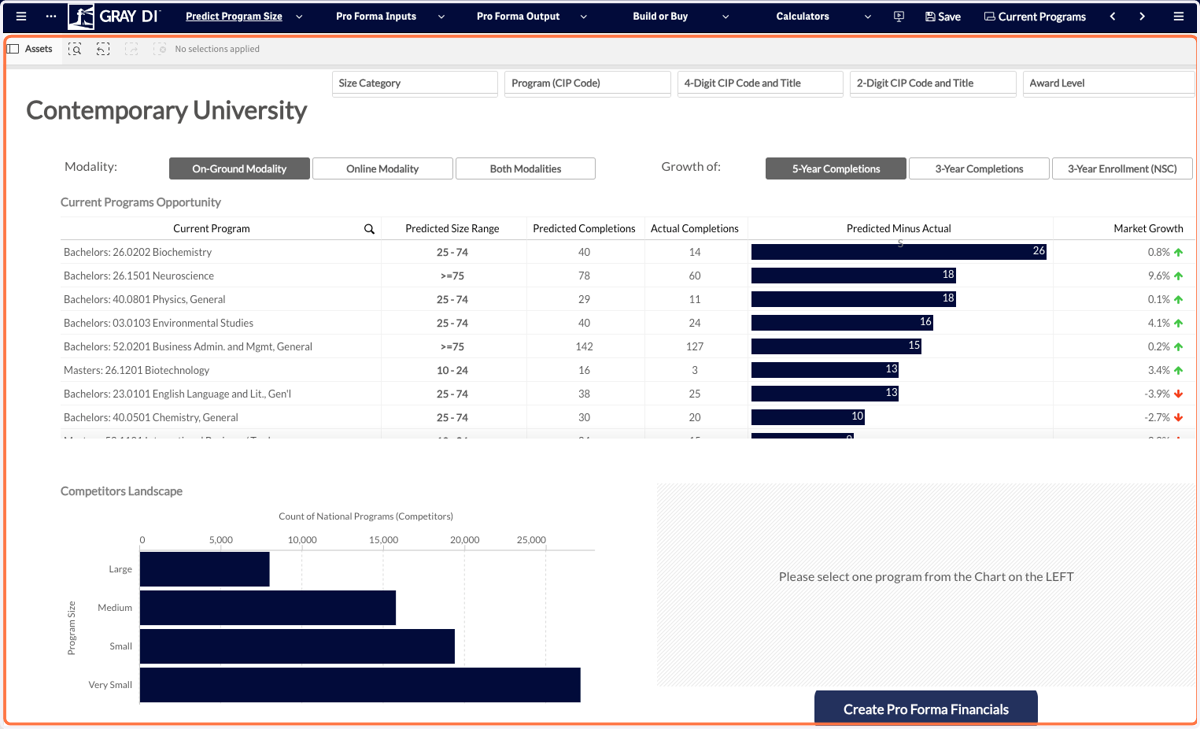
15. With your current programs, we can compare the predicted number of completions to your actual number of completions in the most recent year of data.
The bar chart shows the difference between your actual number of completions and the model's prediction. This allows you to identify potential opportunities to grow your current programs.
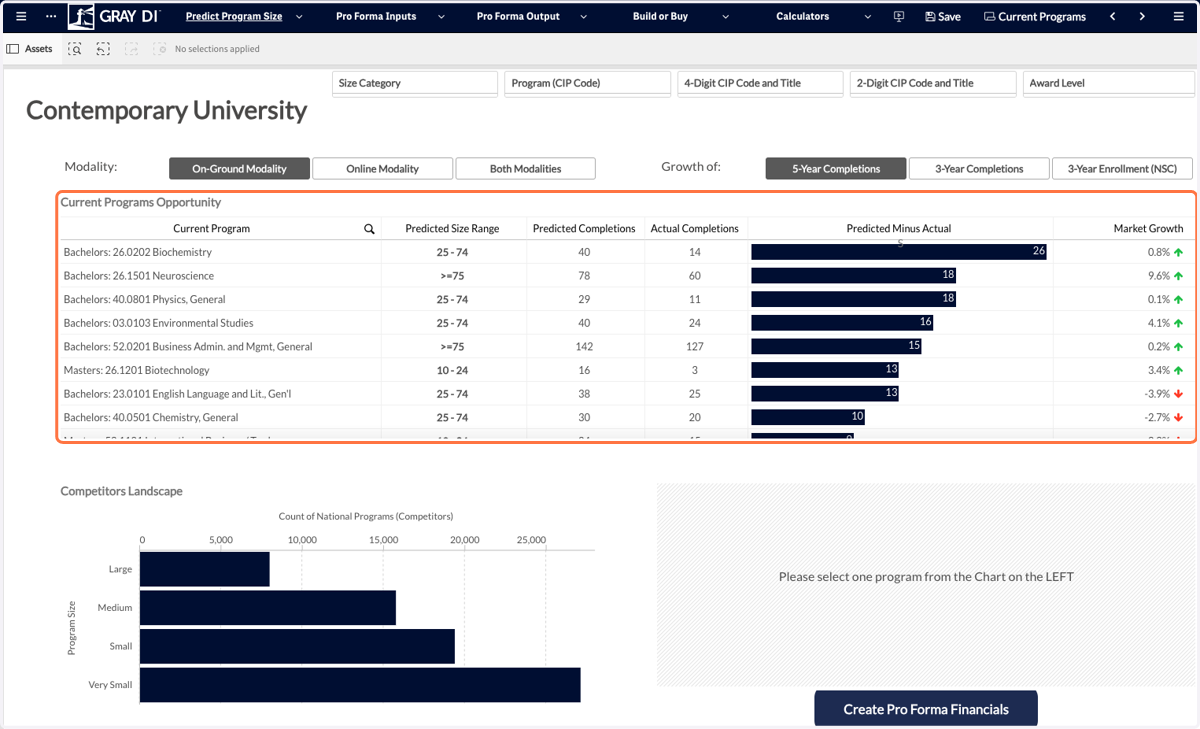
16. You can sort this table by clicking on any column header. This will sort from high to low based on that column.
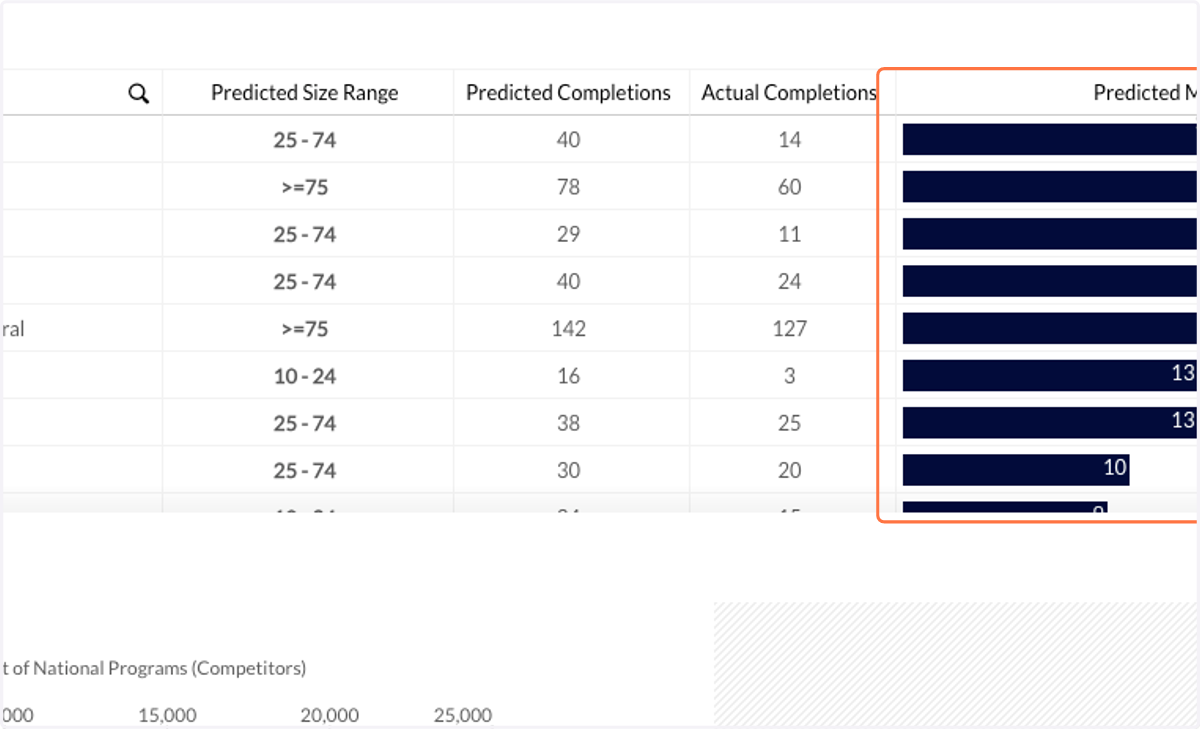
17. To view competitive information select one program by clicking on it in the table.
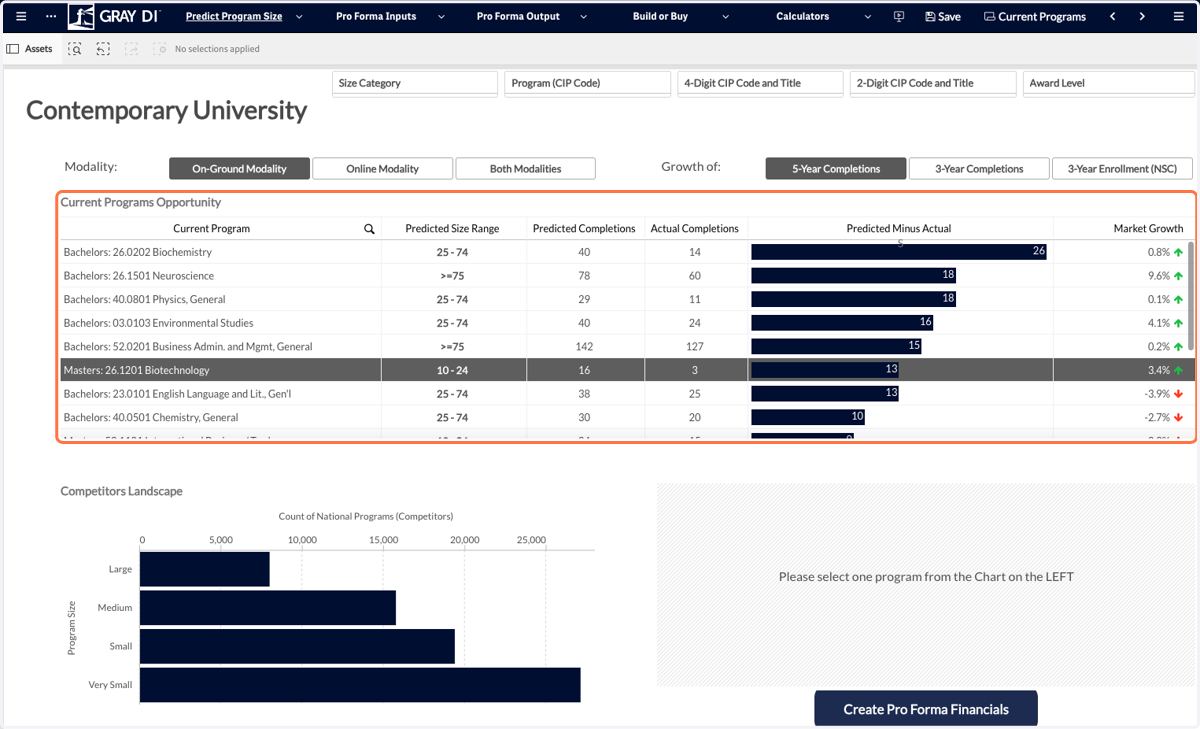
18. Now you can view both the competitive landscape and the list of competitors for your selected program.
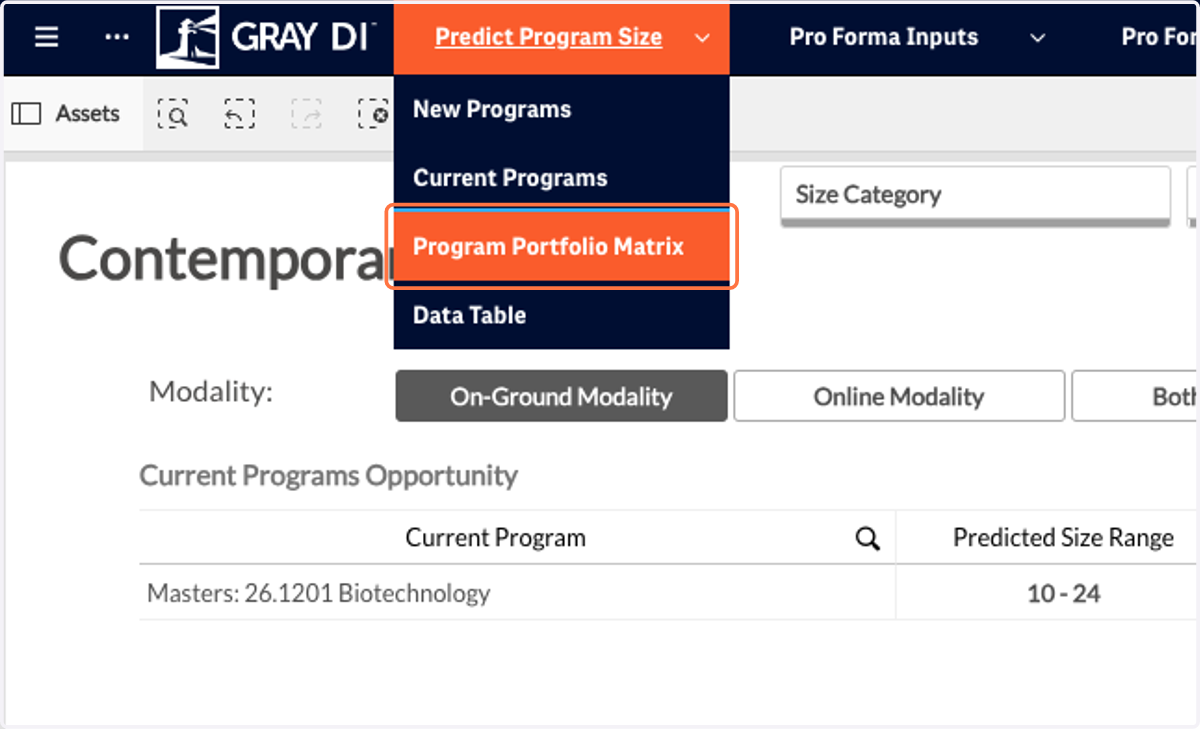
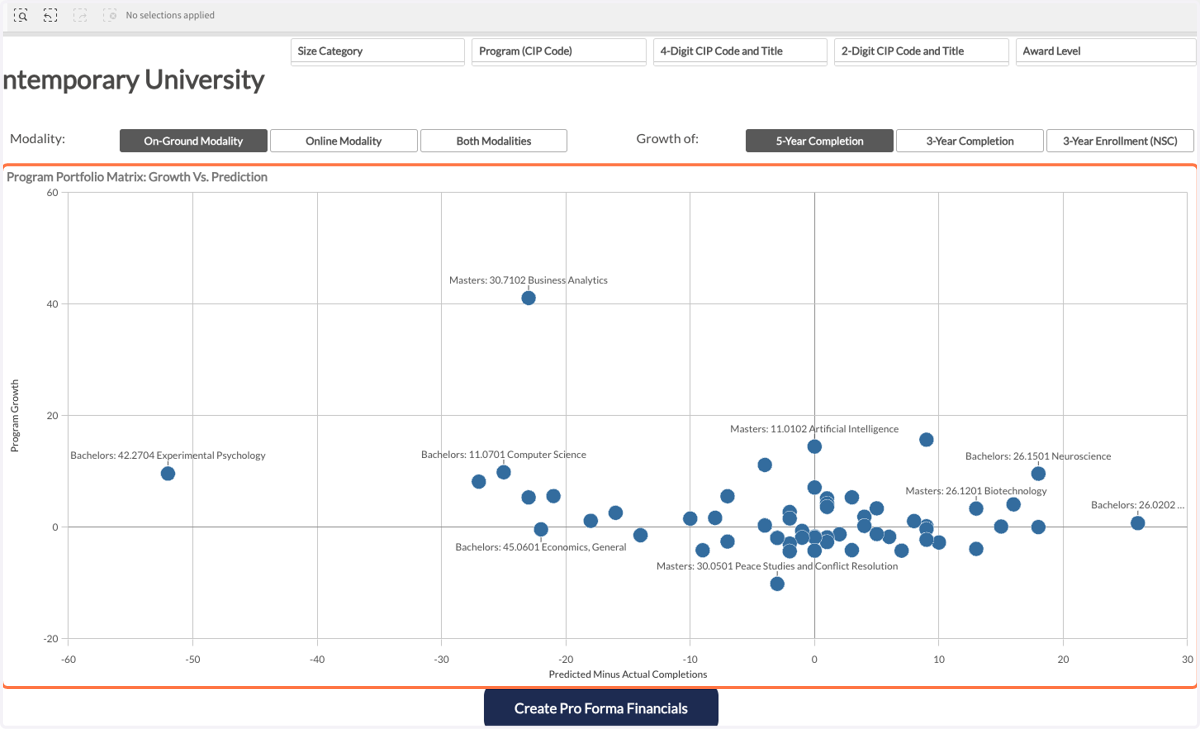
19. Another view of your current programs is the Program Portfolio Matrix.
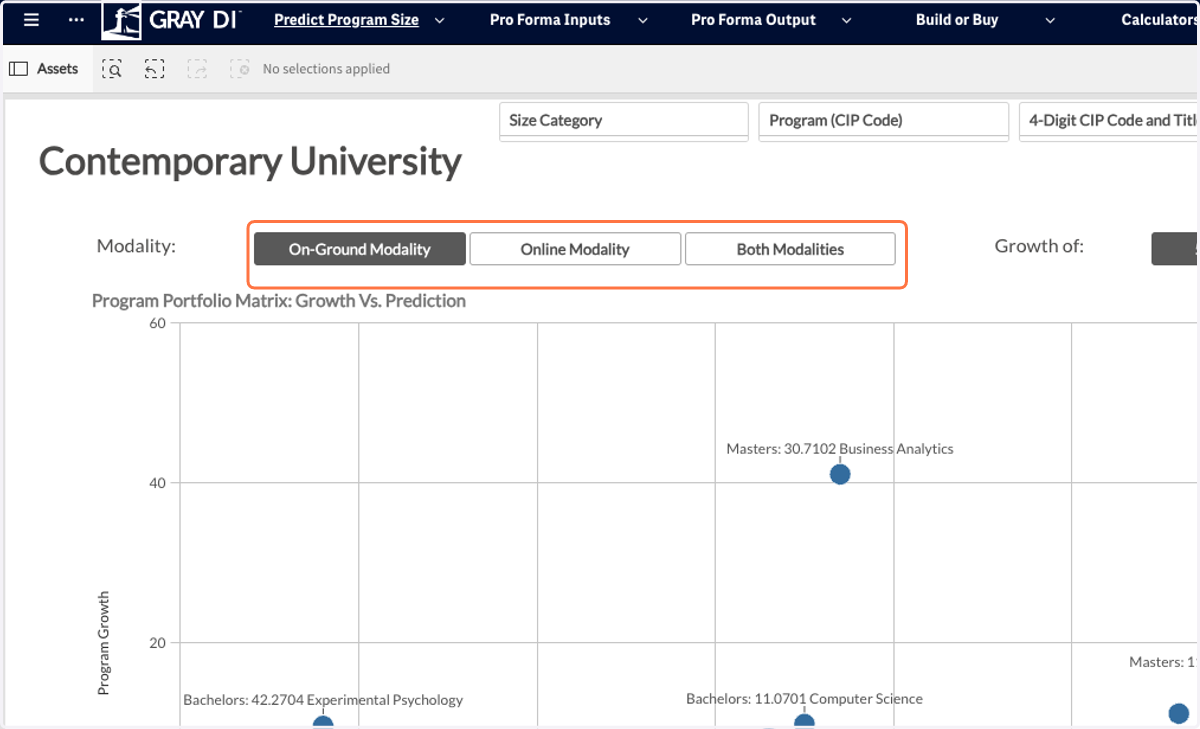
20. You can toggle this view by modality to see each subset of your portfolio.
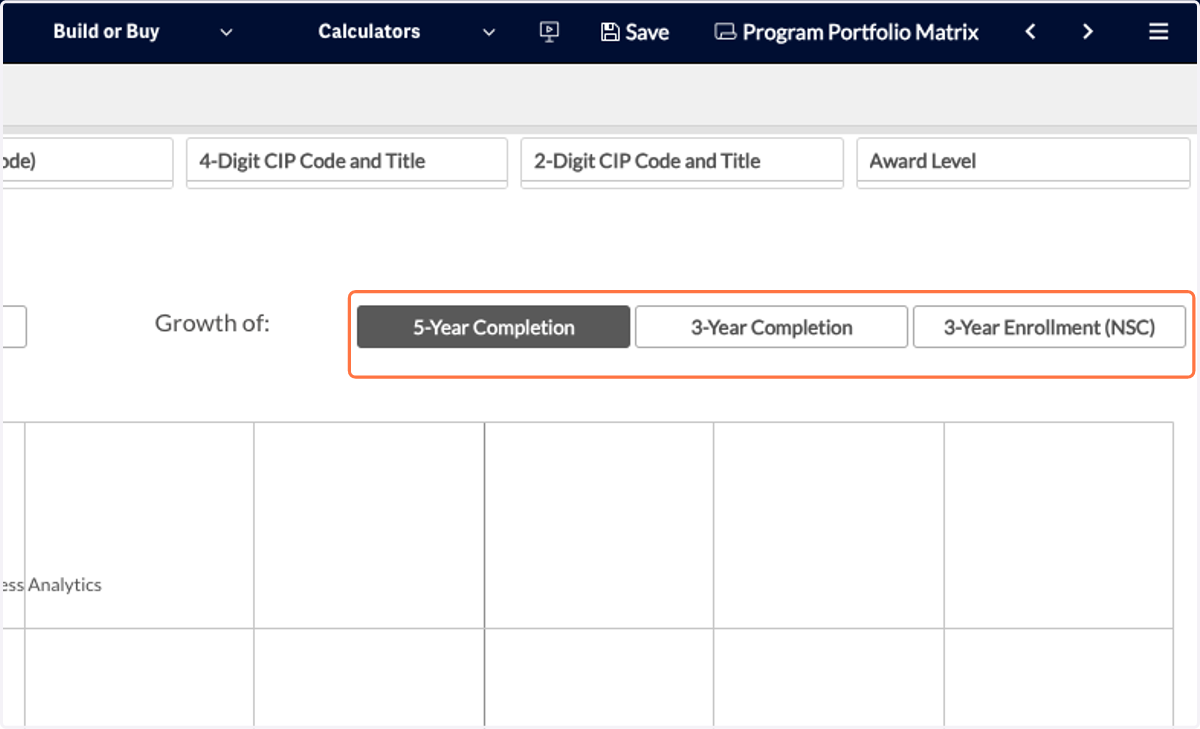
21. You can also select the market growth metric you would like to graph.
22. Now you can see a scatter plot of your current programs where the X-axis is the difference between predicted and actual completions, and the Y-axis is the market growth in your selected metric.
This view is a great way to identify programs that are both experiencing a growing market and are predicted to be larger than your current program. This could indicate a set of opportunities to grow your current programs.
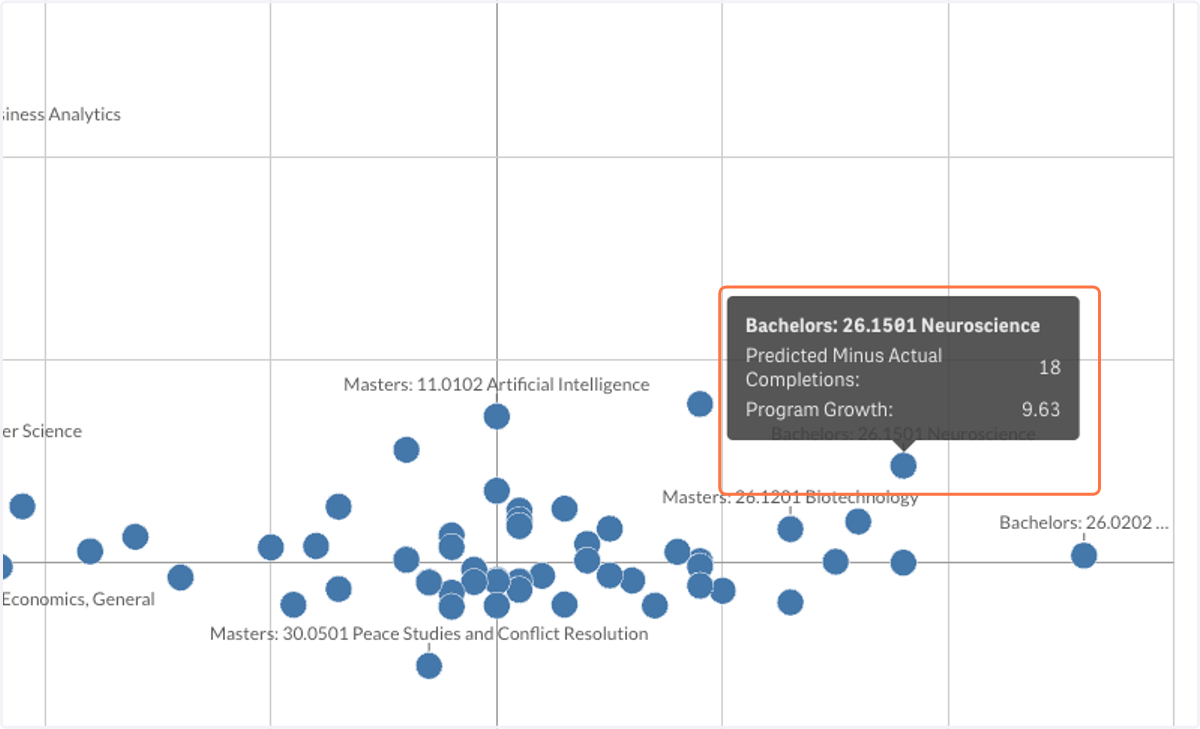
23. You can hover over a single program to see the details of each metric.
24. The last option for viewing this data is the Data Table.
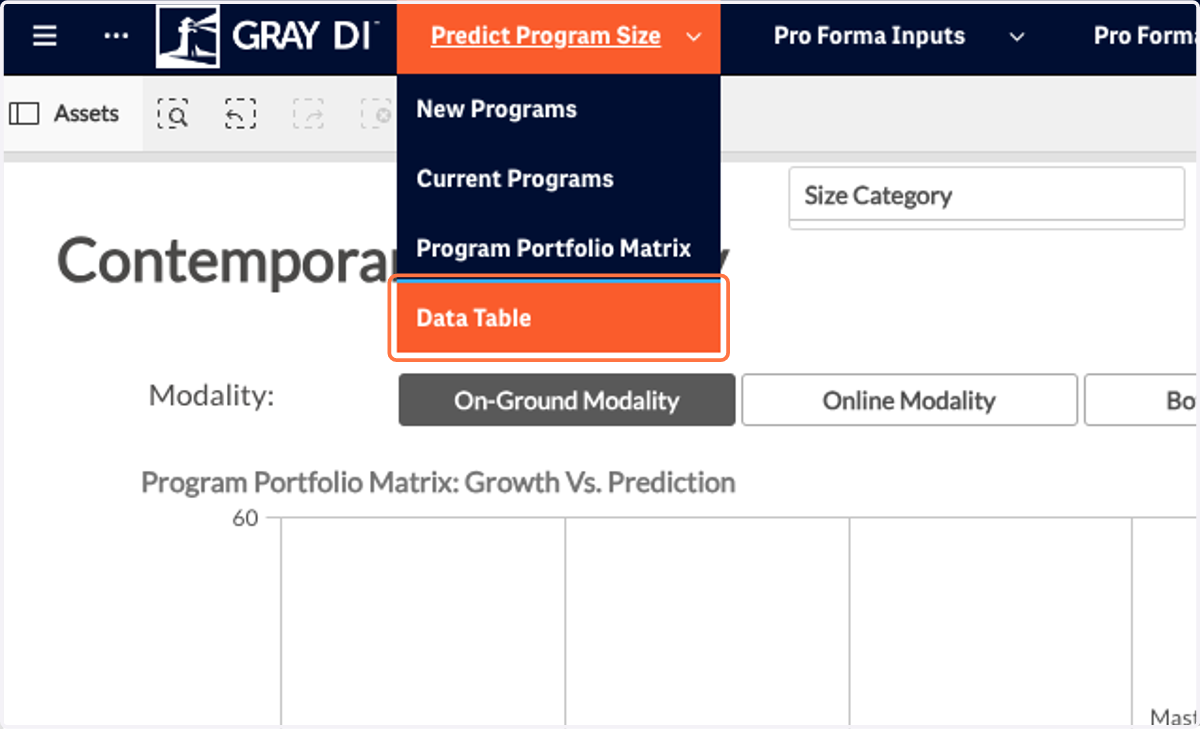
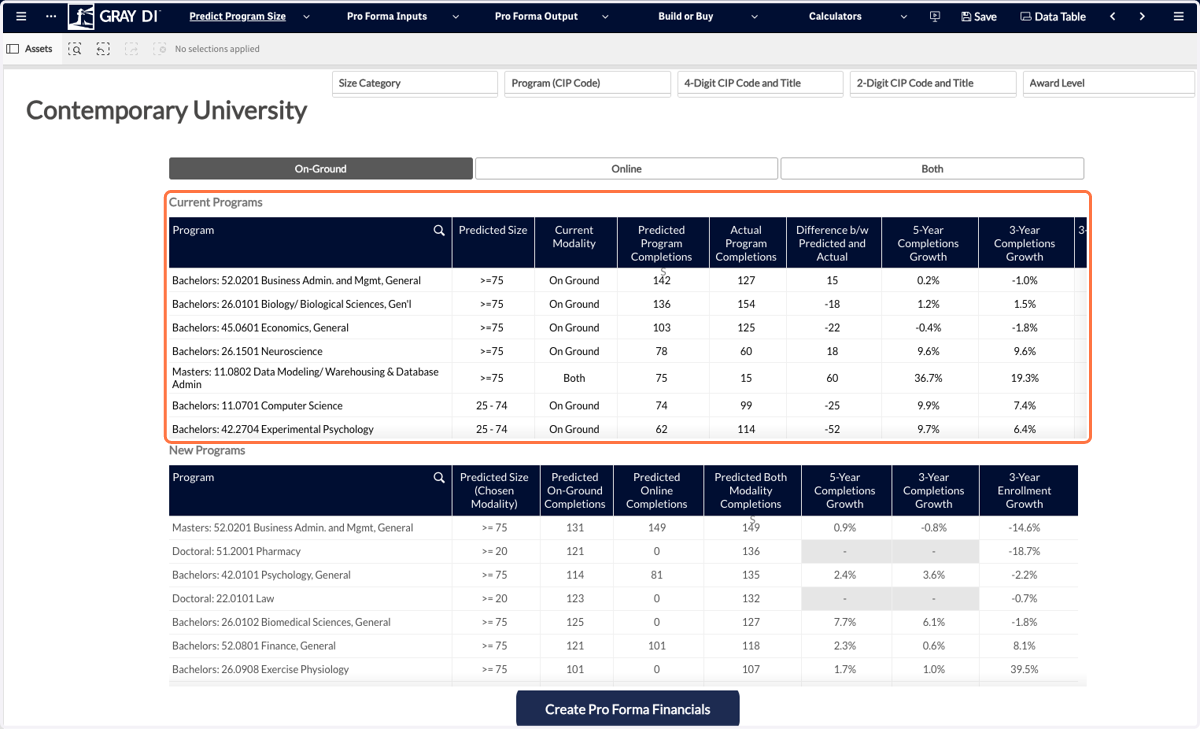
25. The Data Table provides a breakdown of predictions by modality and market growth for your current programs.
Note: You can sort this table by clicking on any column header. This will sort from high to low in that metric.
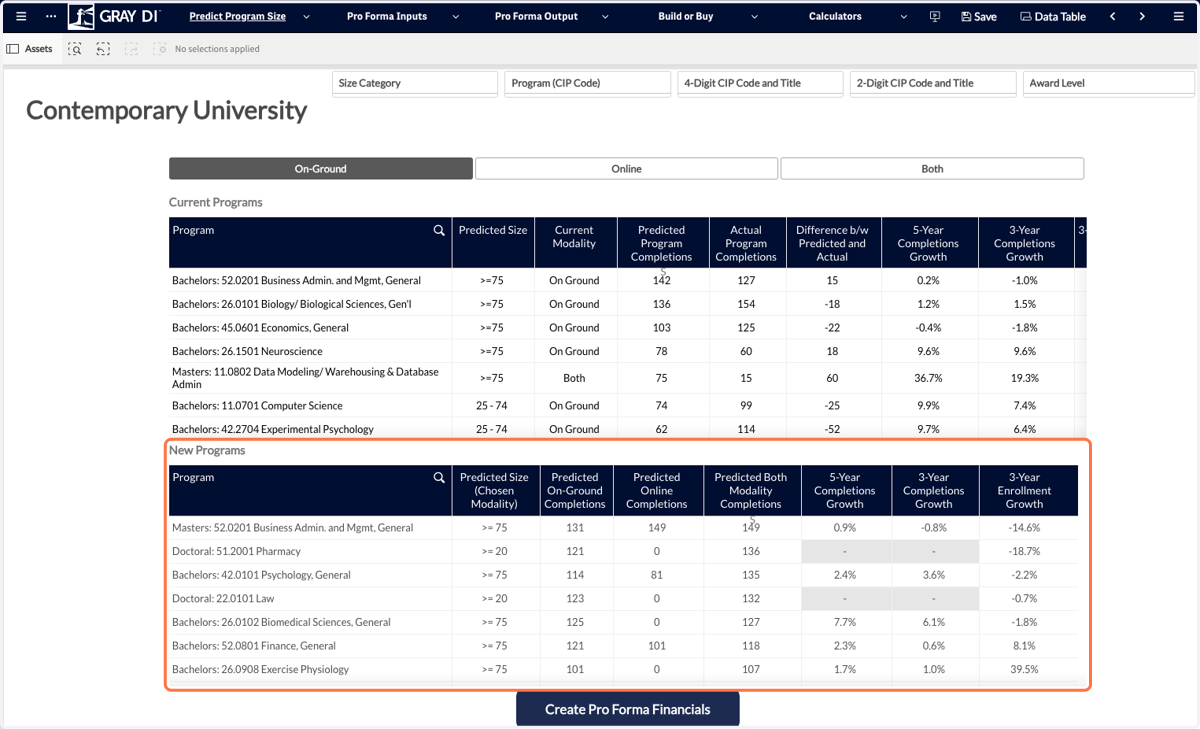
26. You can also see the same table for all new programs.
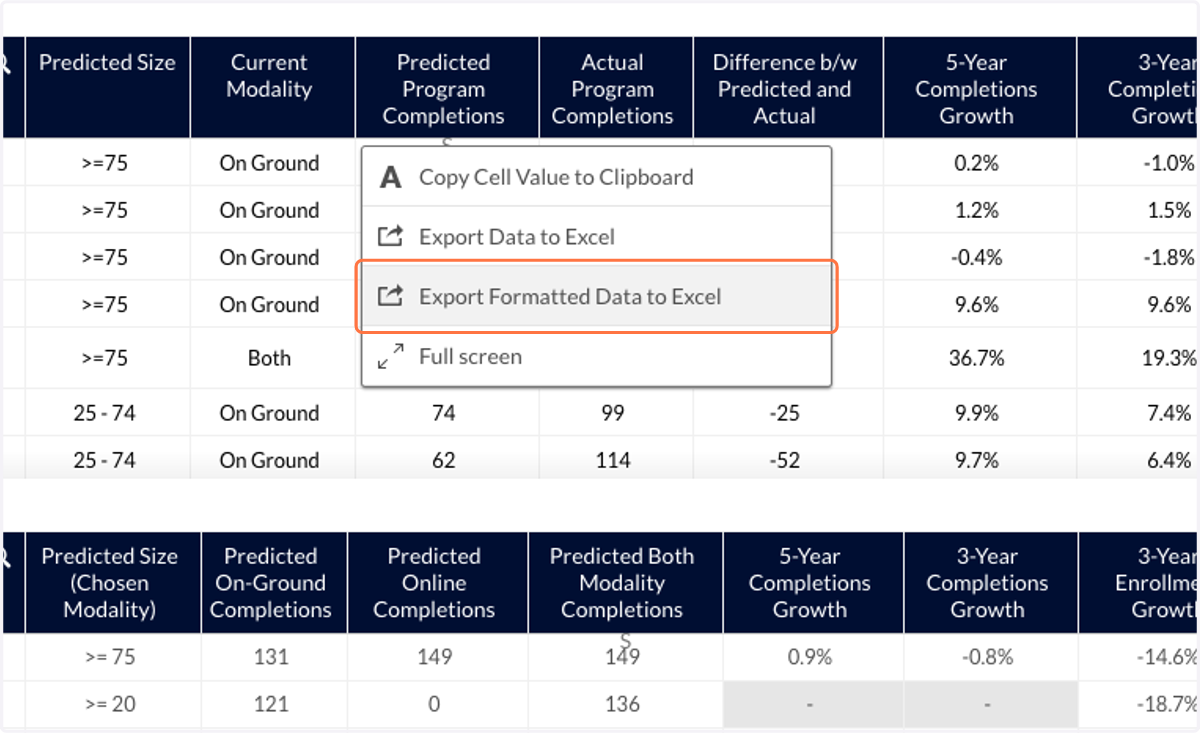
27. To export data, right-click anywhere inside of the table.
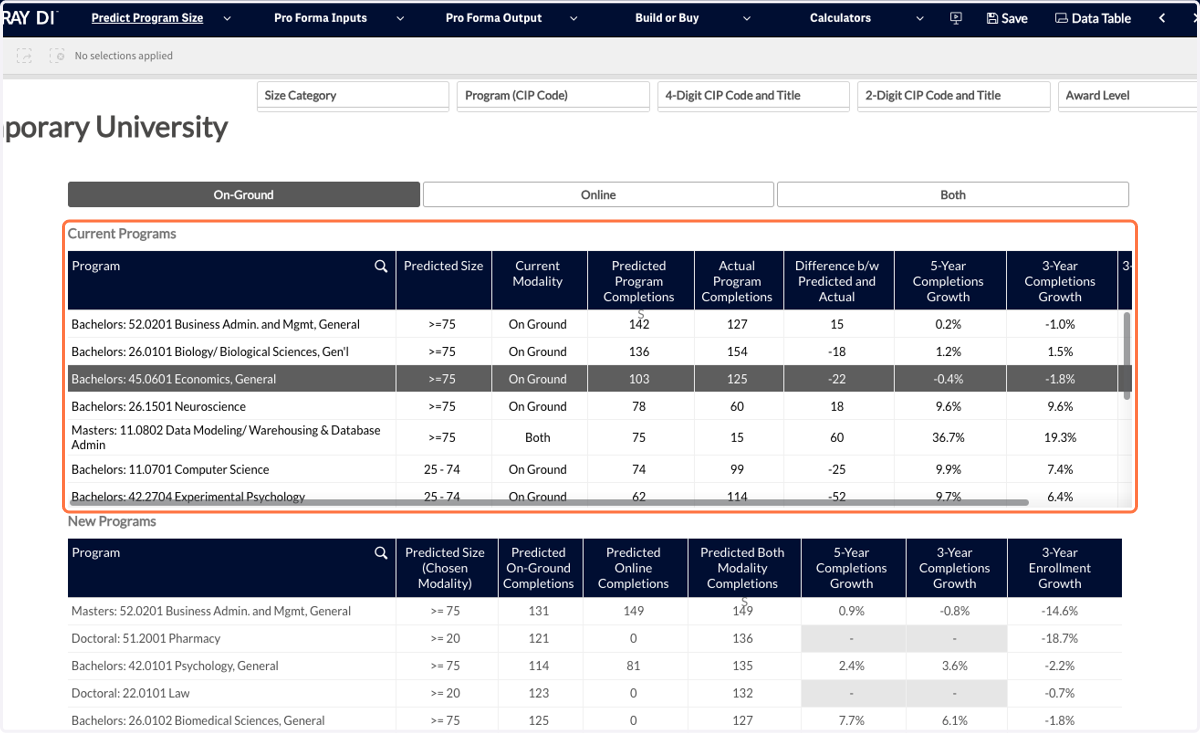
28. Then select Export Formatted Data to Excel. You can then find the Excel file in your downloads folder.