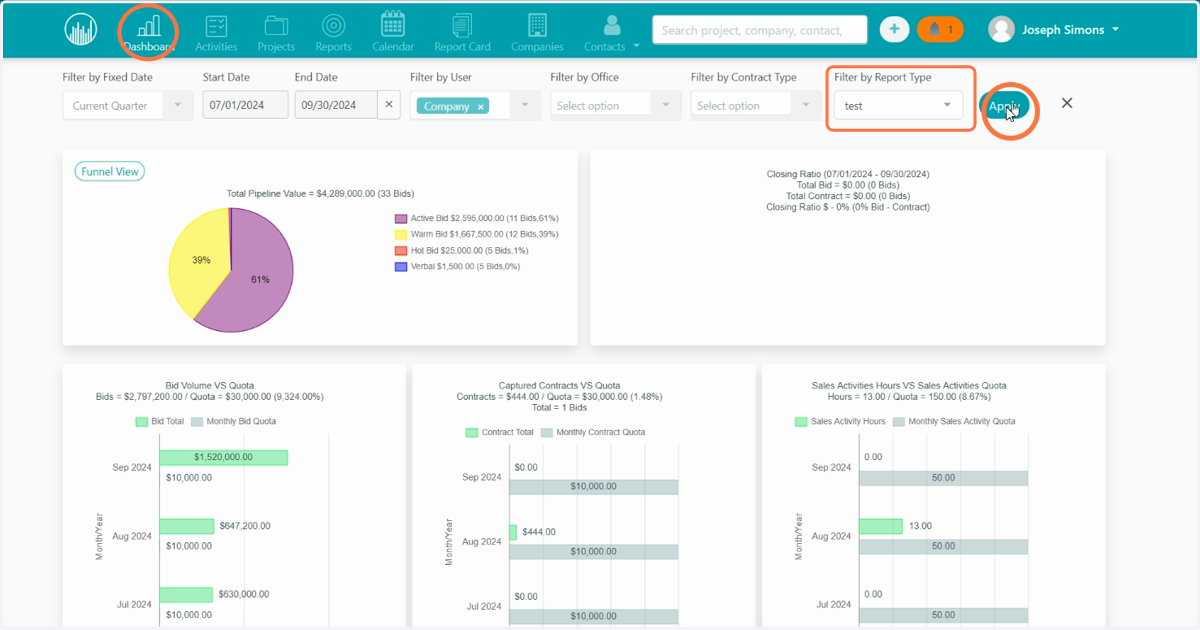
New Custom Reporting Enhancement
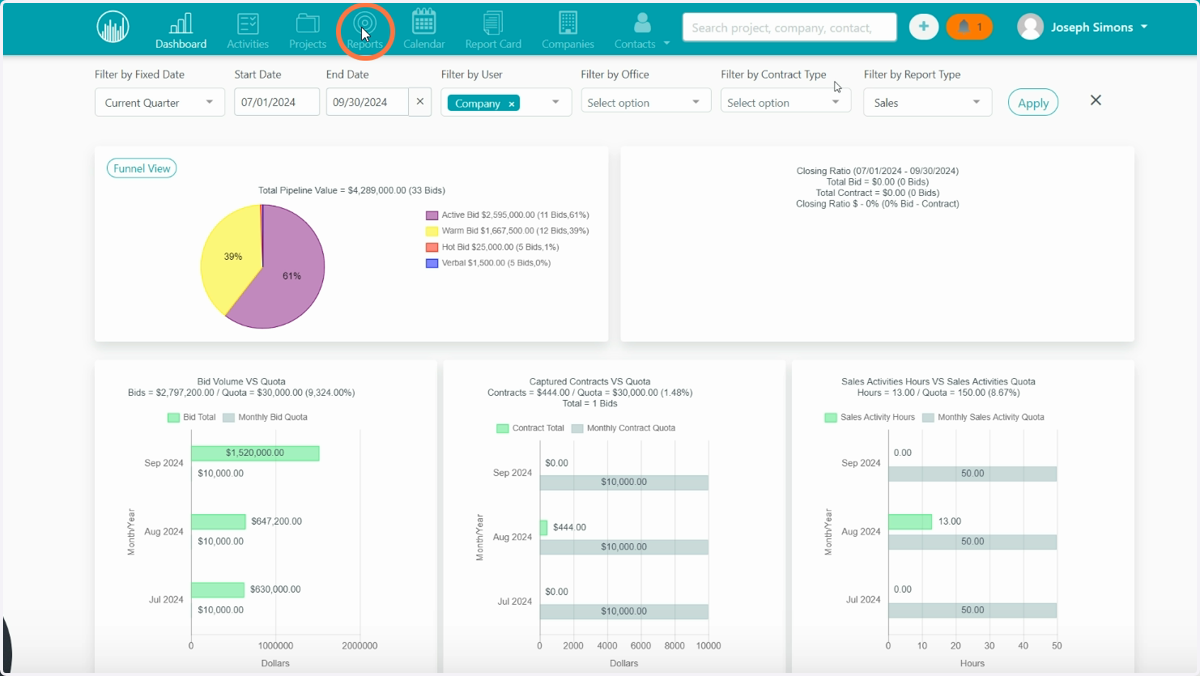
1. 1. Click Reports
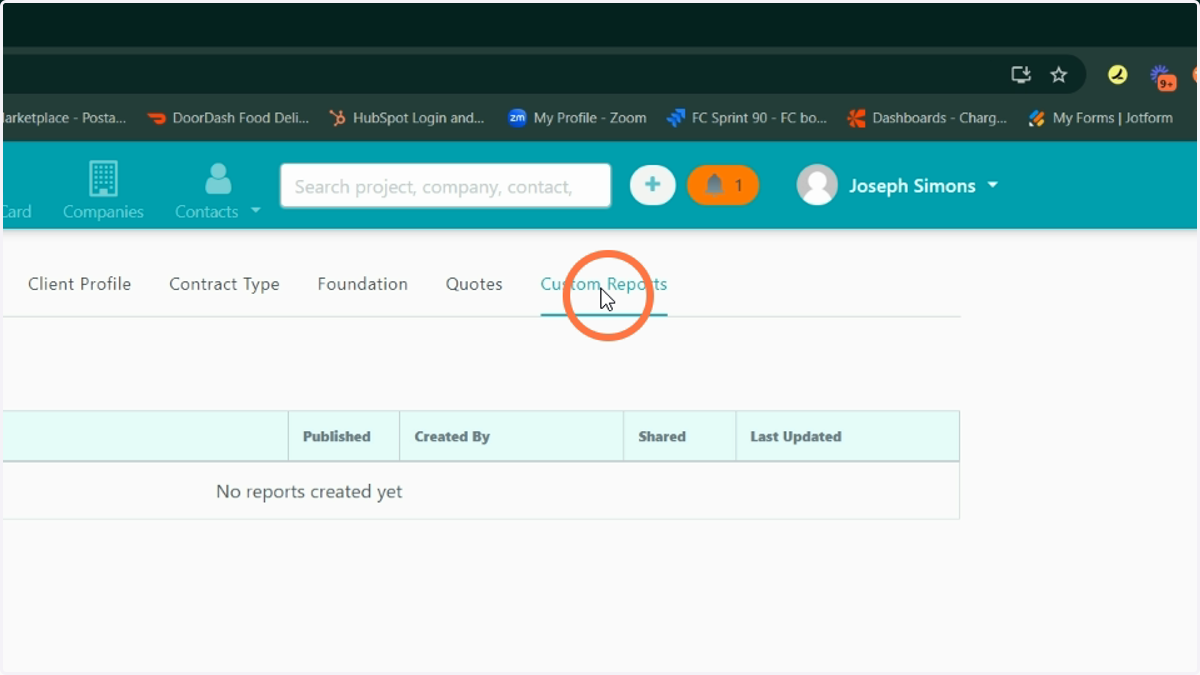
2. 2. Click Custom Reports
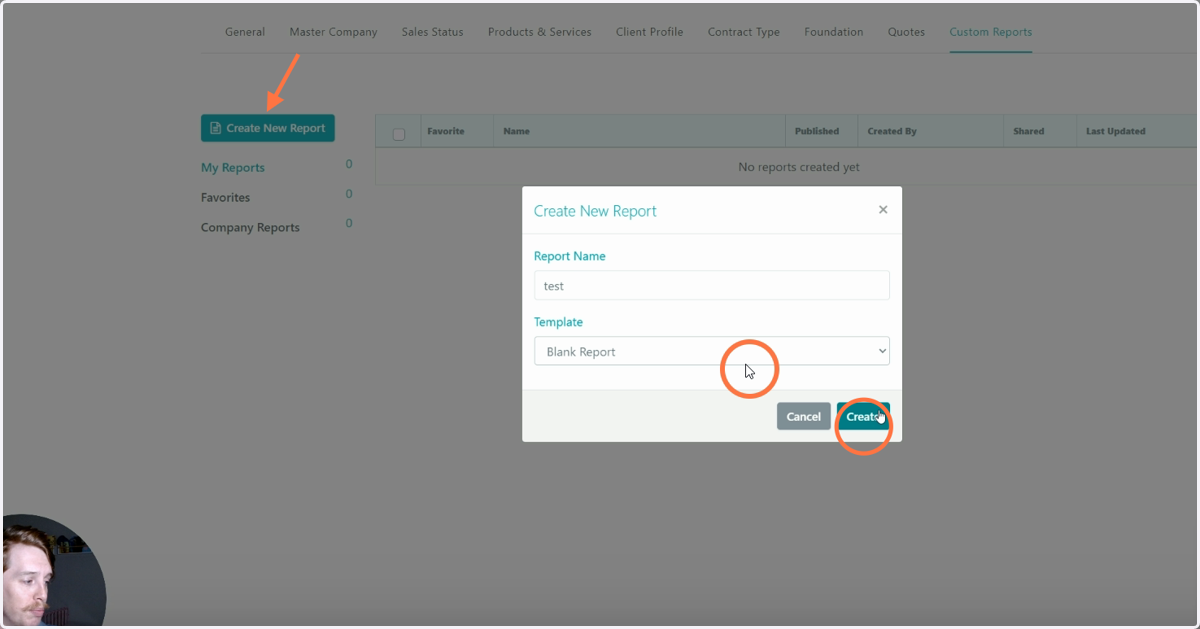
3. 3. Create New Report
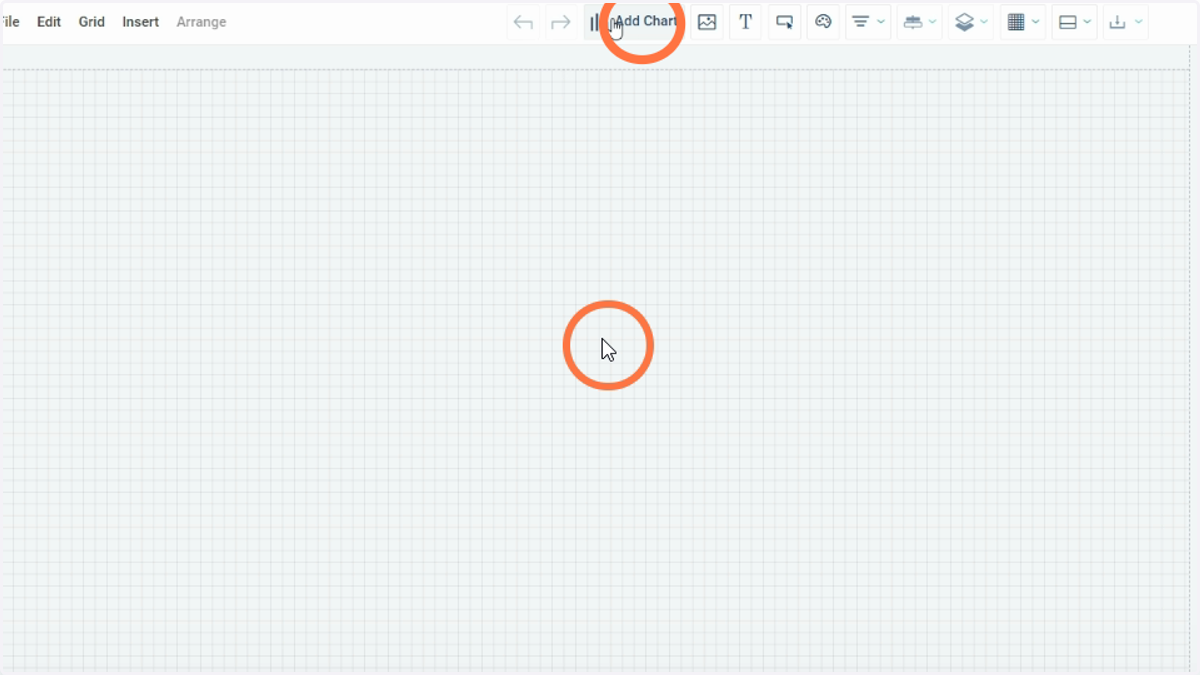
4. 4. Add Chart
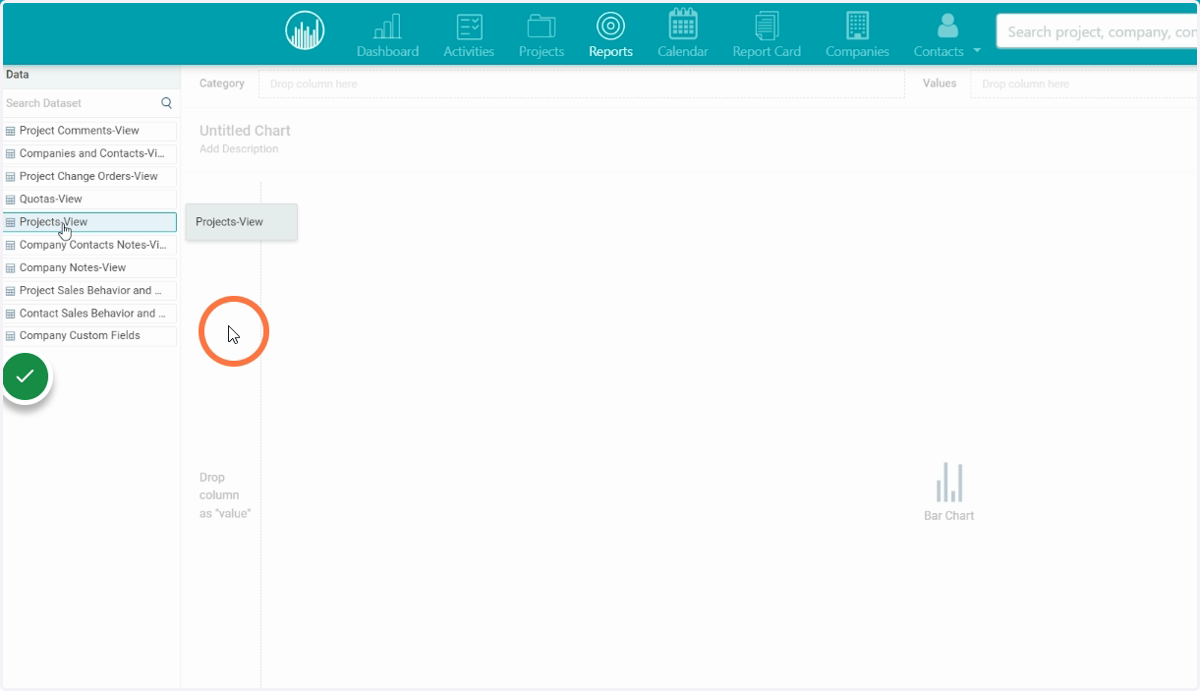
5. 5. Select View
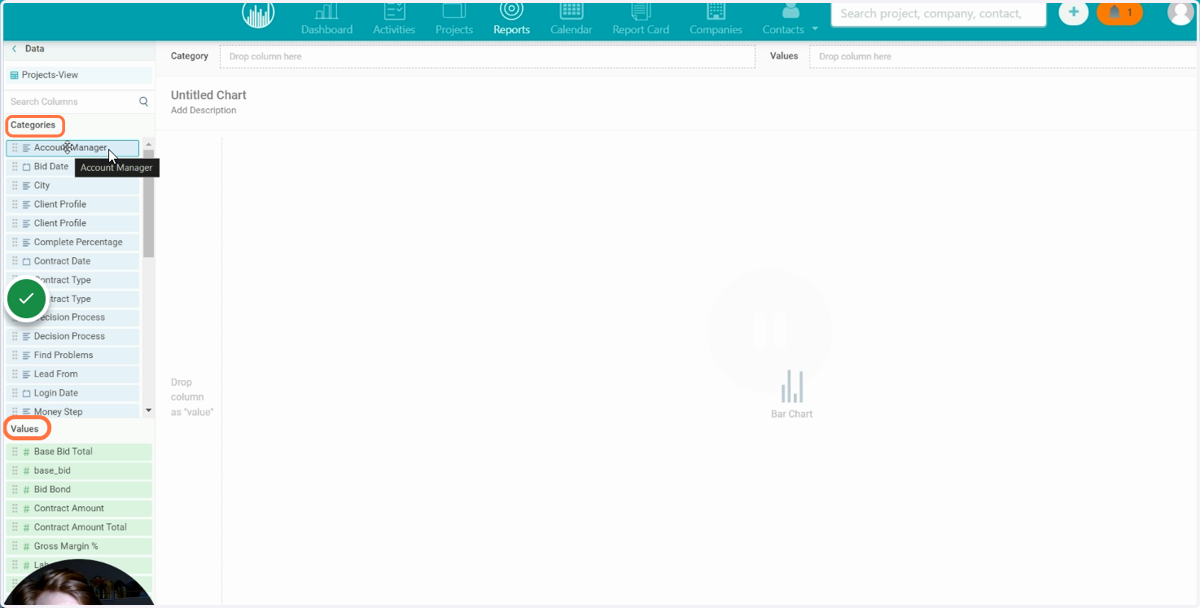
6. 6. Add Category and Value
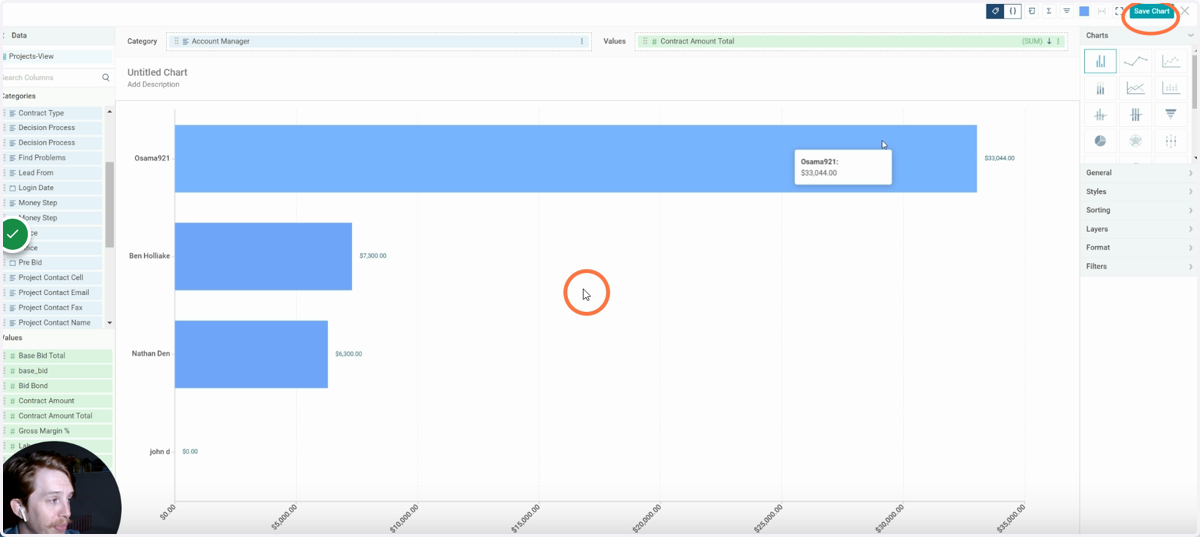
7. 7. View Results and Save
8. 8. View in Canvas
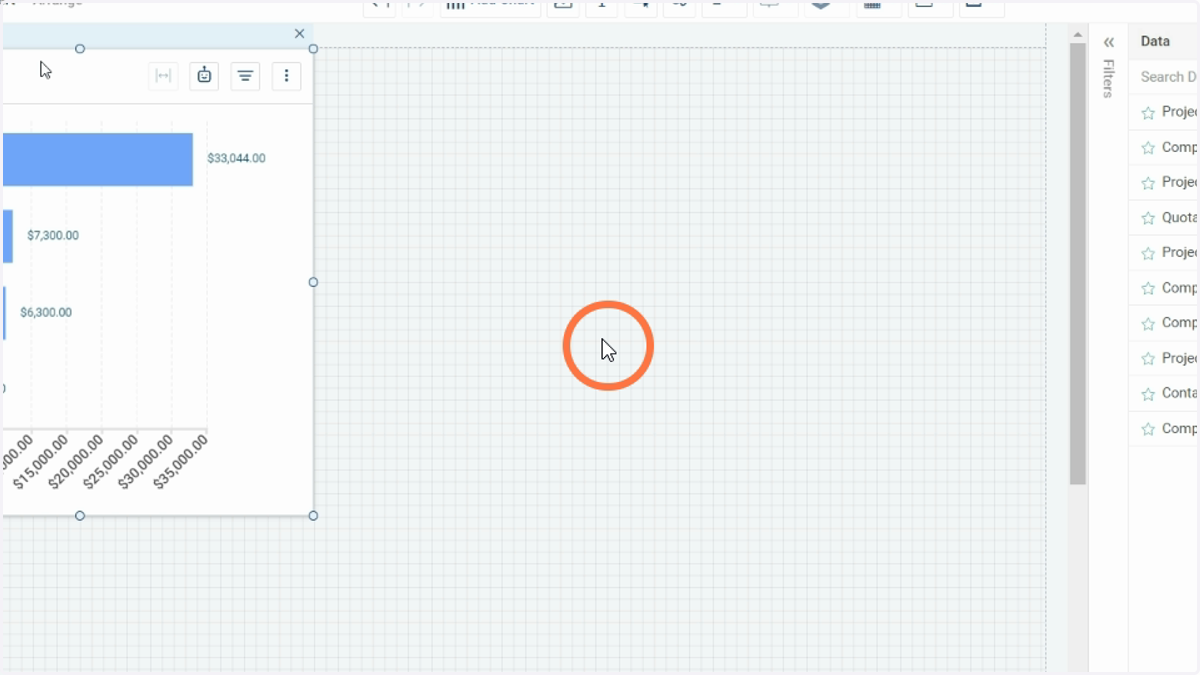
9. 9. Create more charts
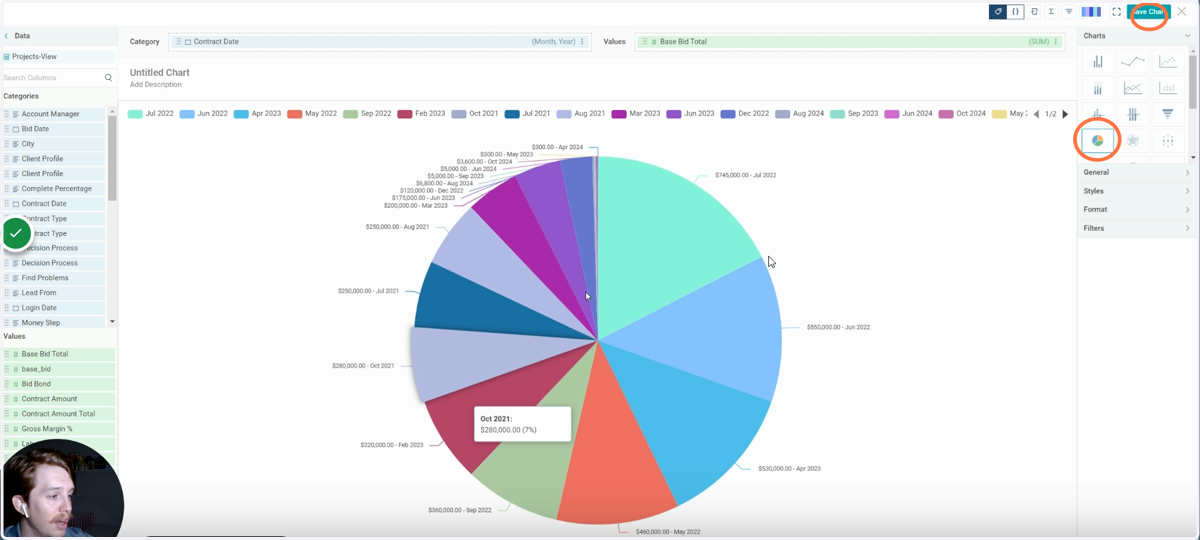
10. 10. Select a Pre-made Chart
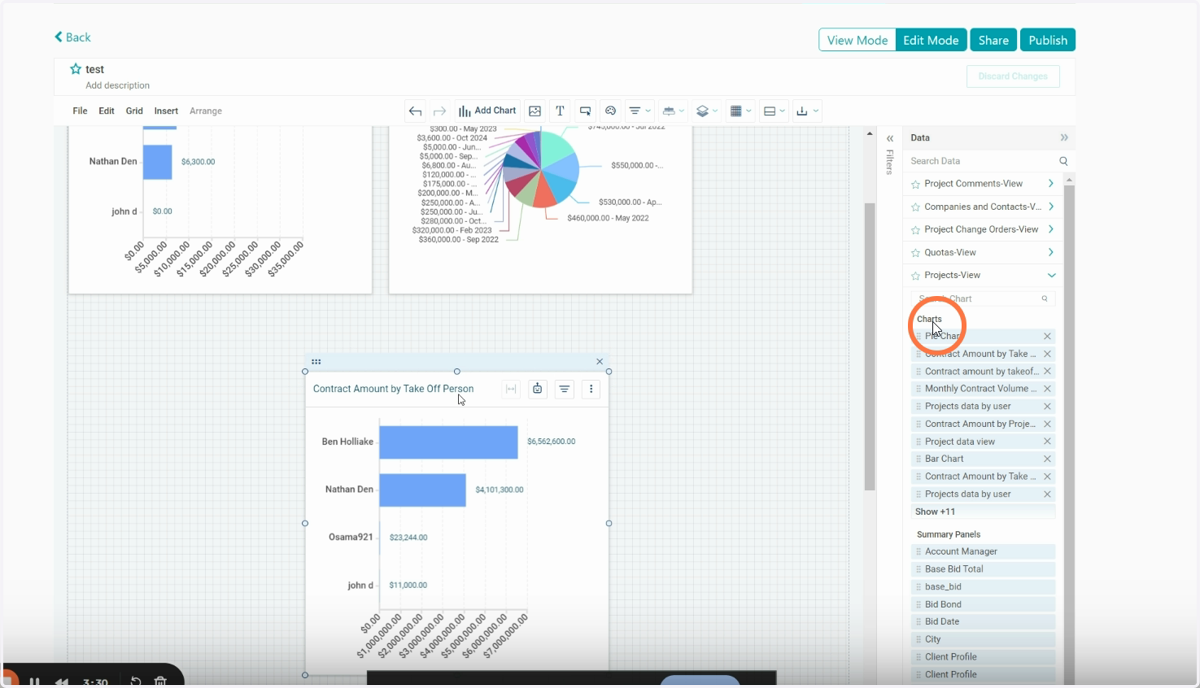
11. 11. Click Publish and it's saved in the Dashboard
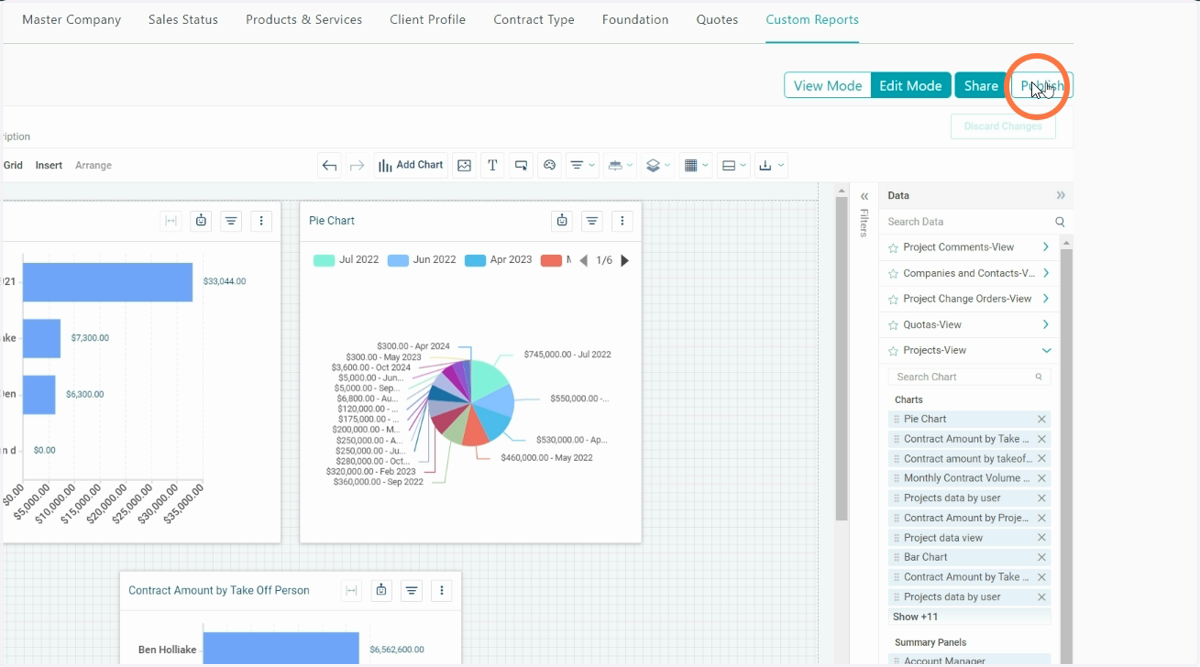
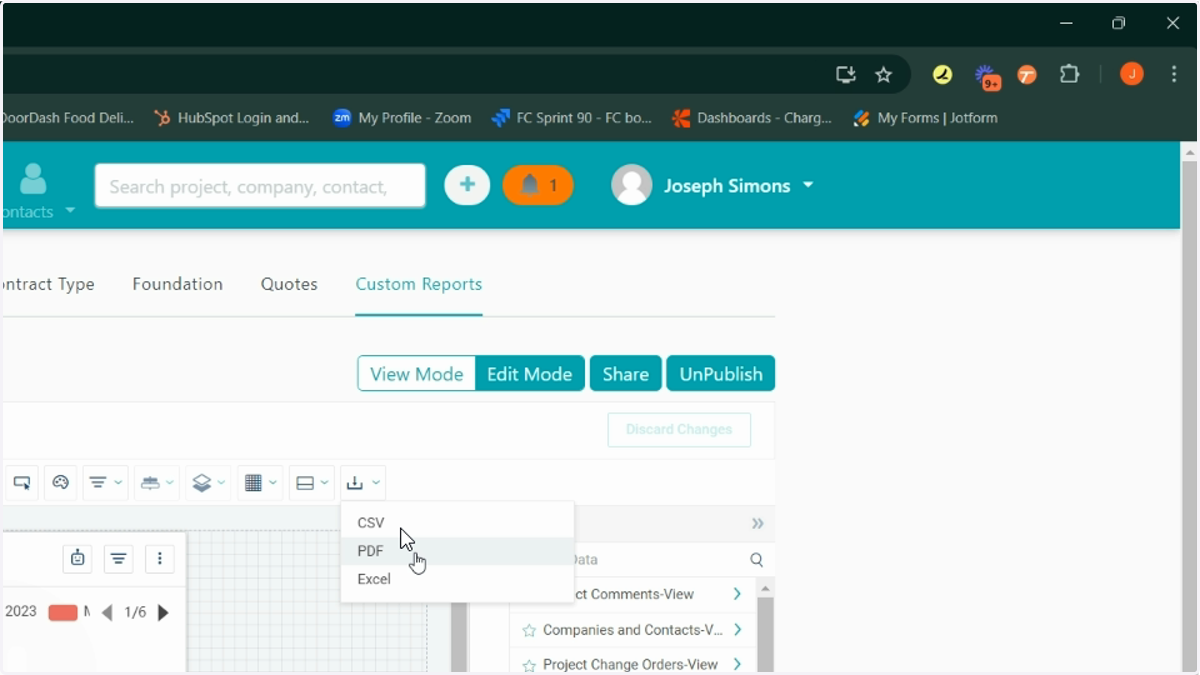
12. 12. You can export it
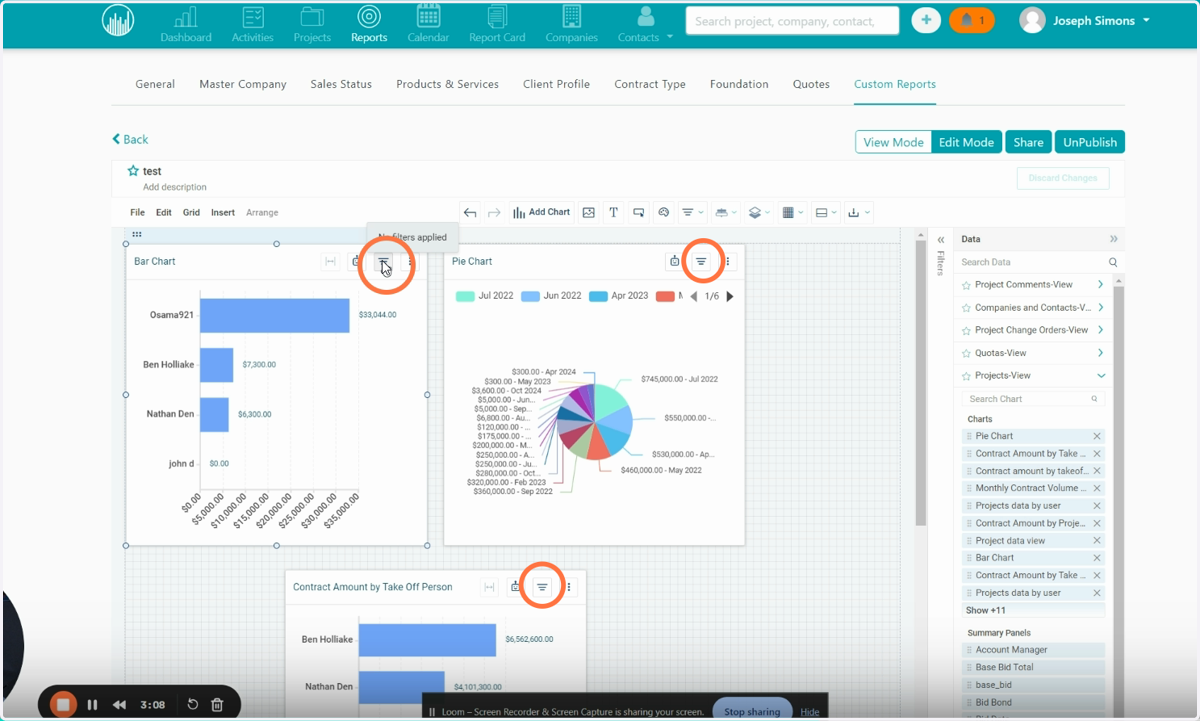
13. 13. You can filter
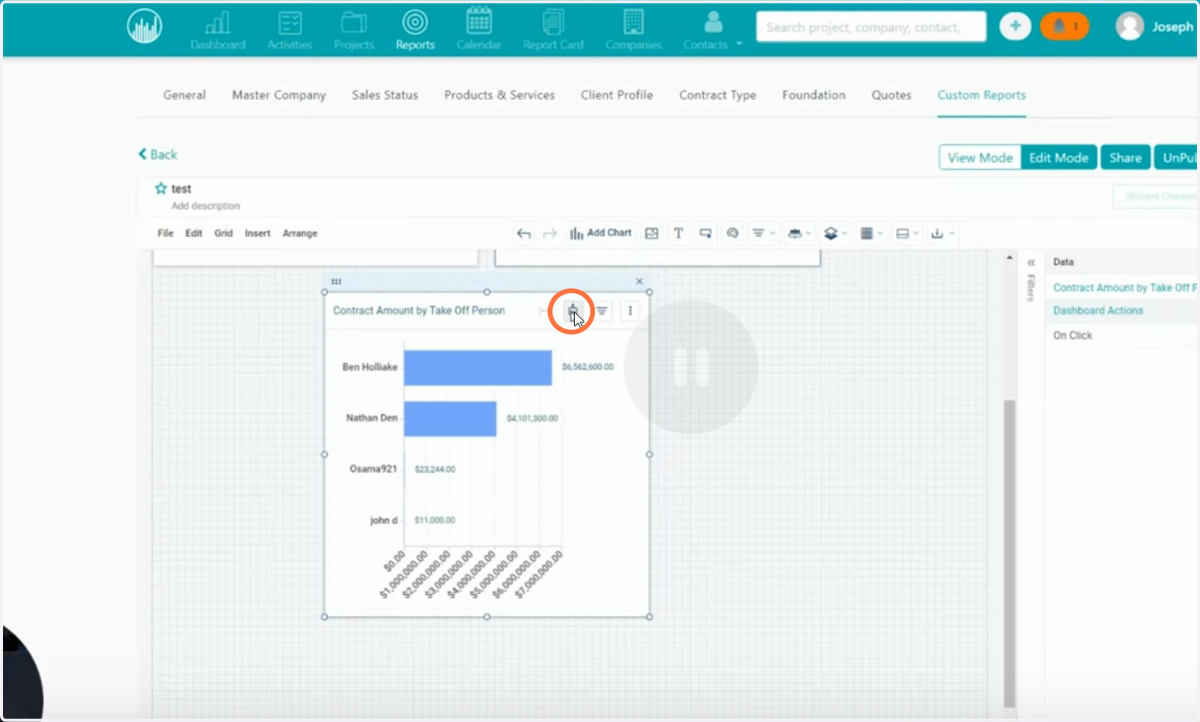
14. 14. You can use SmartAnalyzer
15. 15. You can find it in your Dashboard in Filter by Report Type and Apply