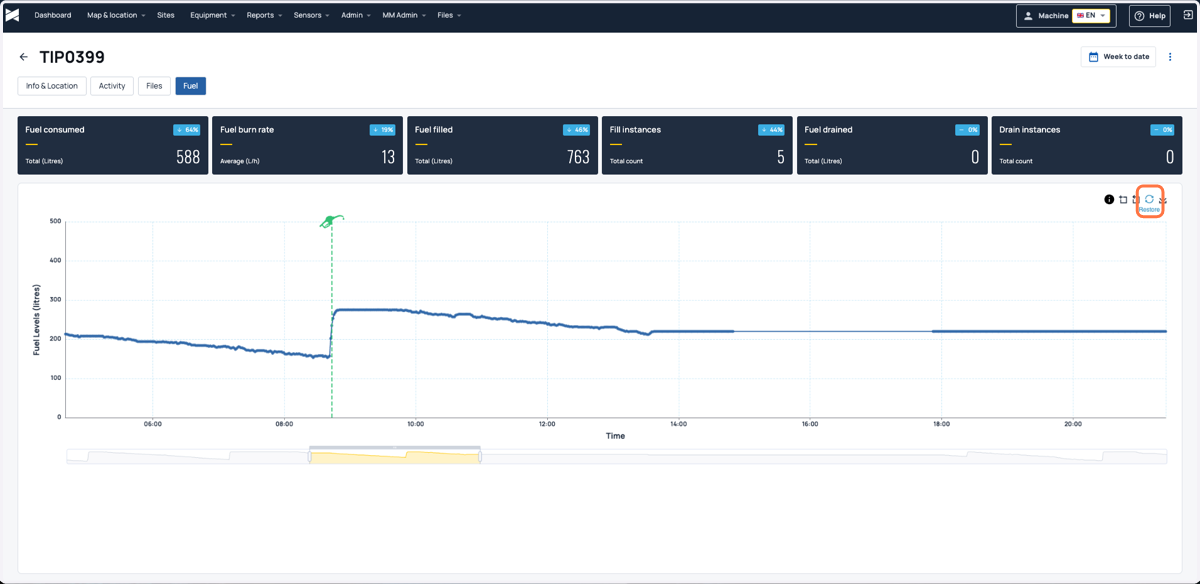
Fuel chart features
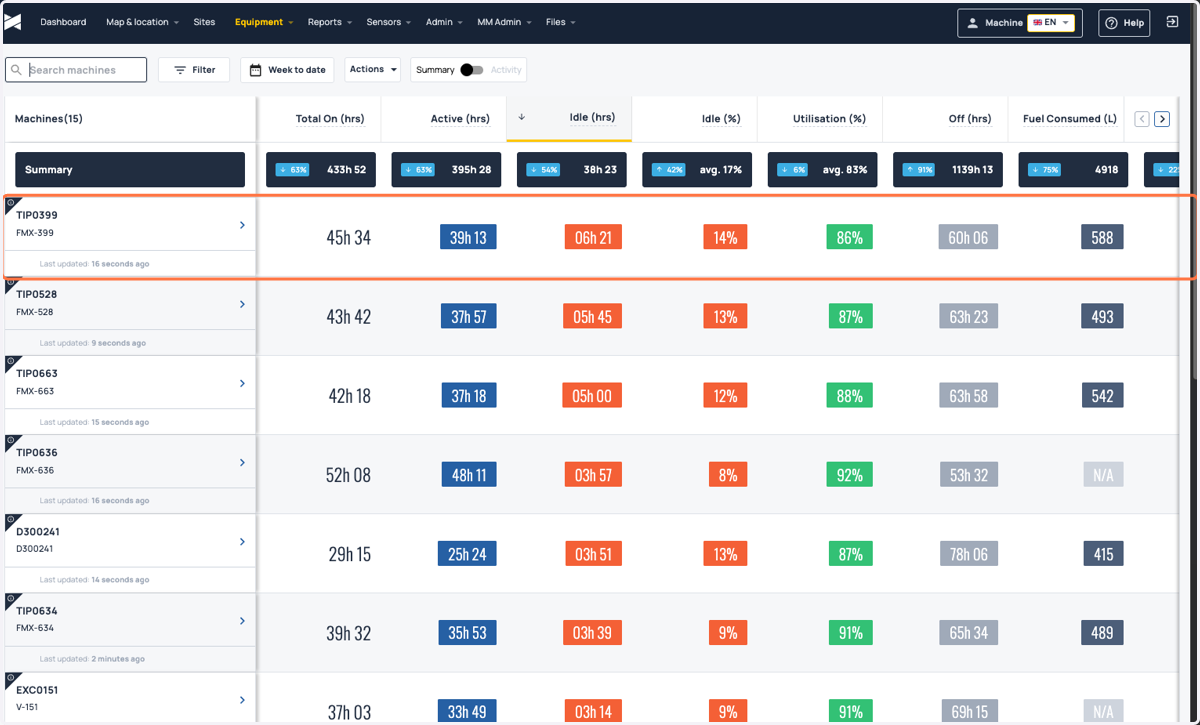
1. Click on the machine where fuel sensor is attached
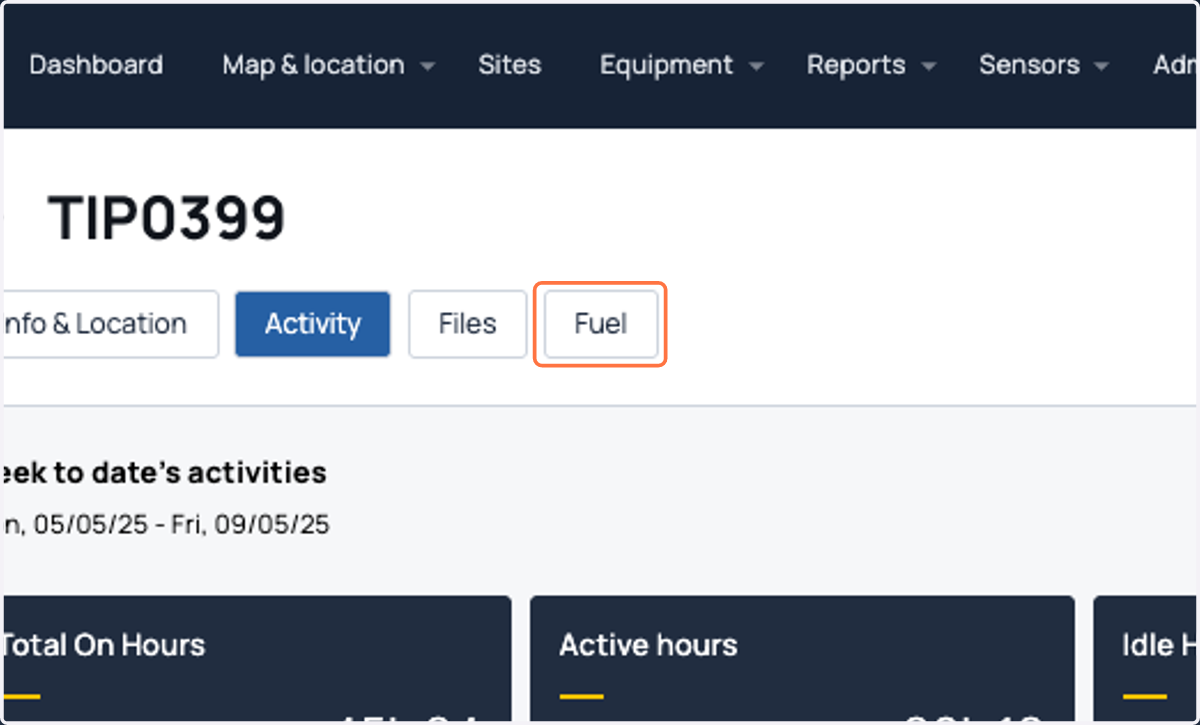
2. Click on Fuel
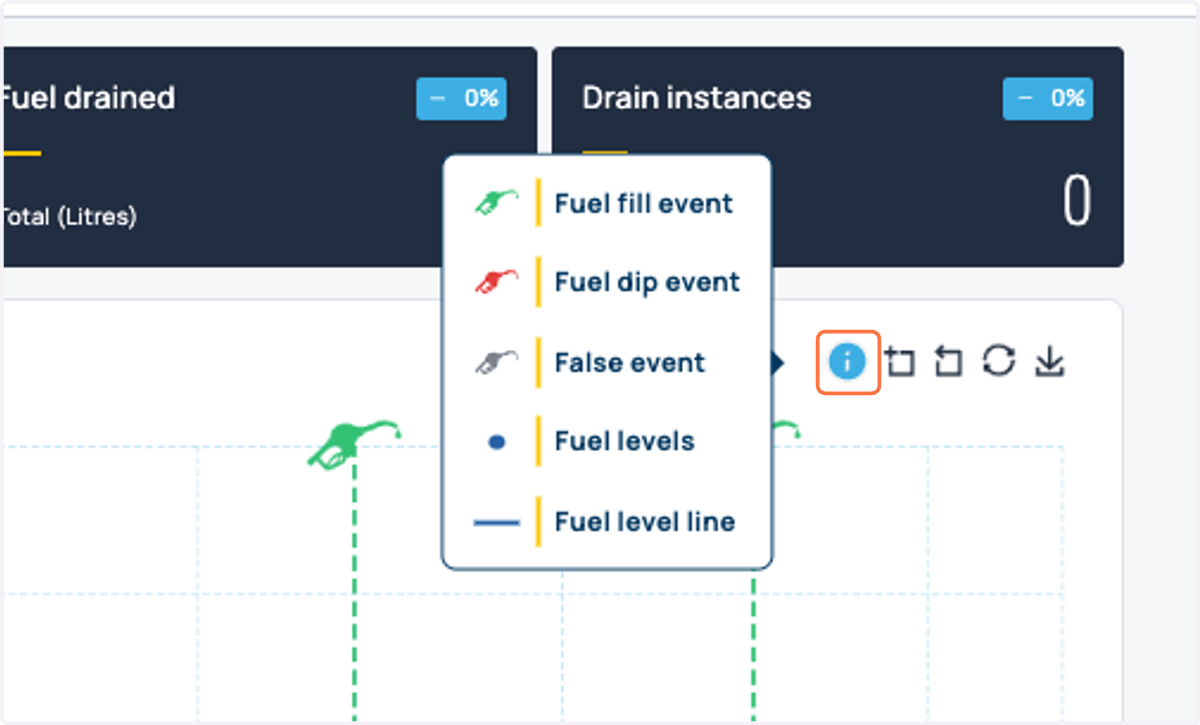
3. On the chart, click or hover on info symbol to know the description of each line in the chart
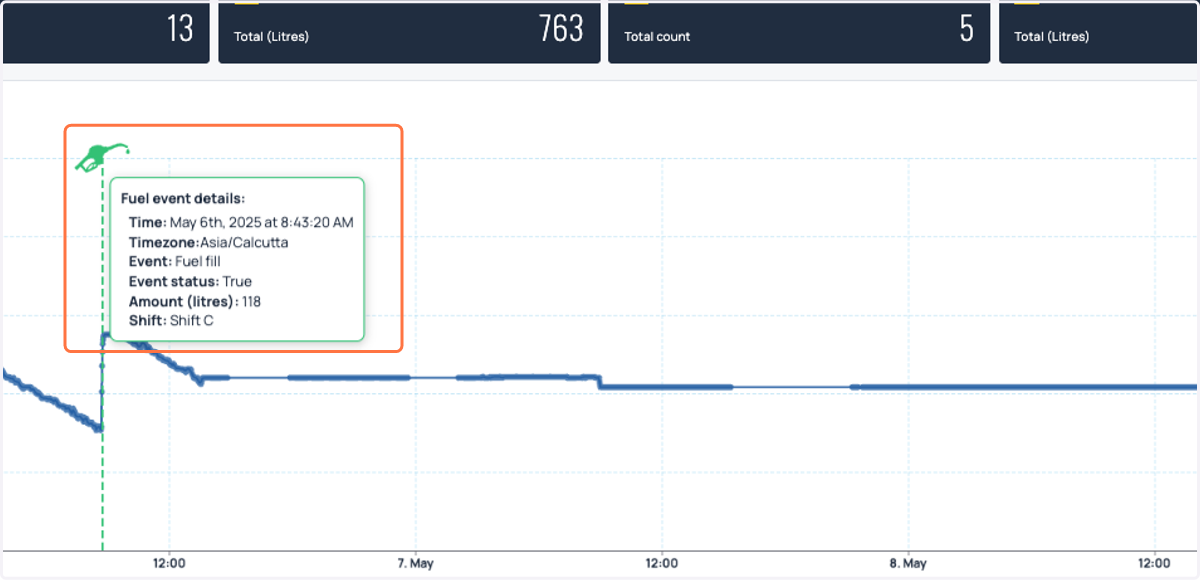
4. Click or hover on a event line to know more details about the event
5. On the top right of the chart, click on the zoom in button to select the zoom option
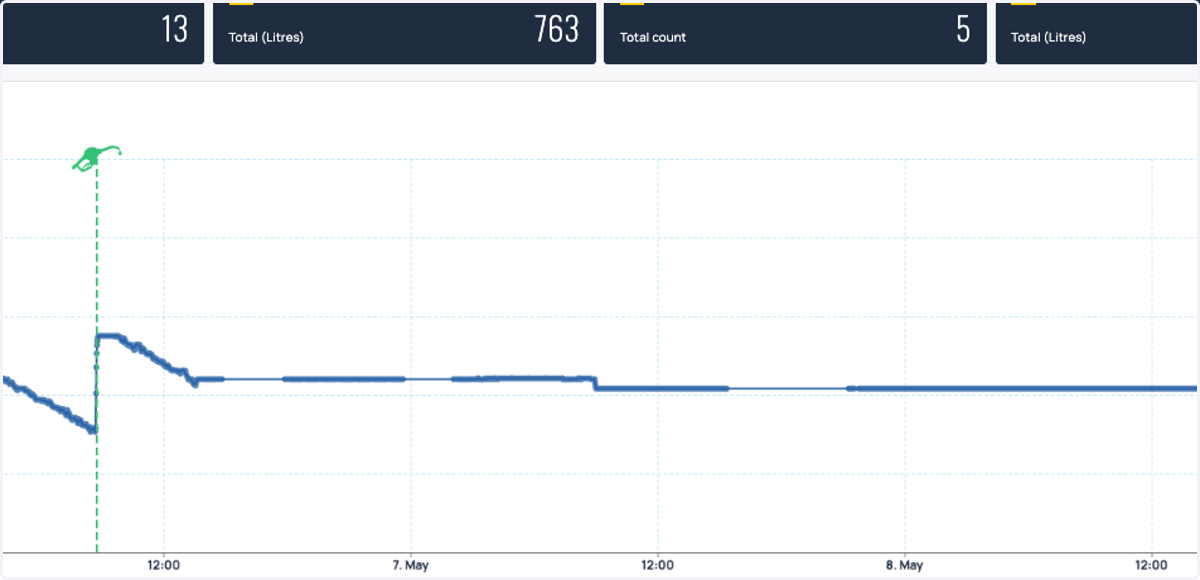
6. Zoom into a time period in the chart by panning through a region on the chart
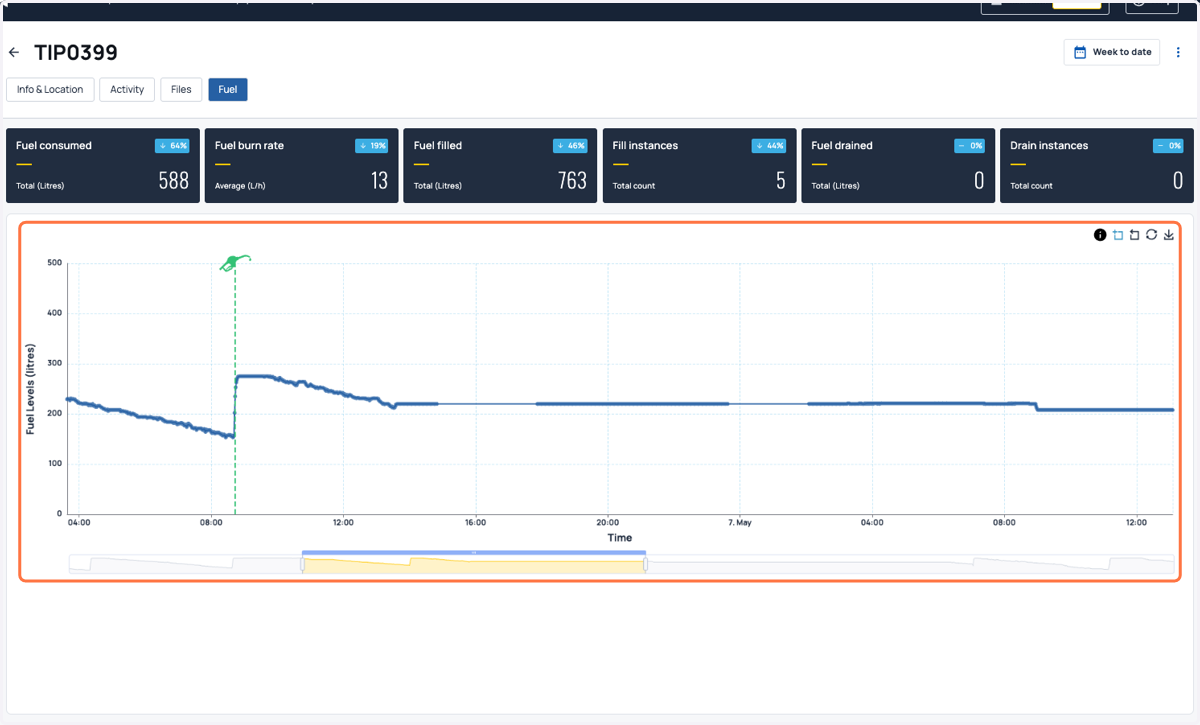
7. You can also zoom in or zoom out by scrolling up or scrolling down respectively using your scroller in the mouse
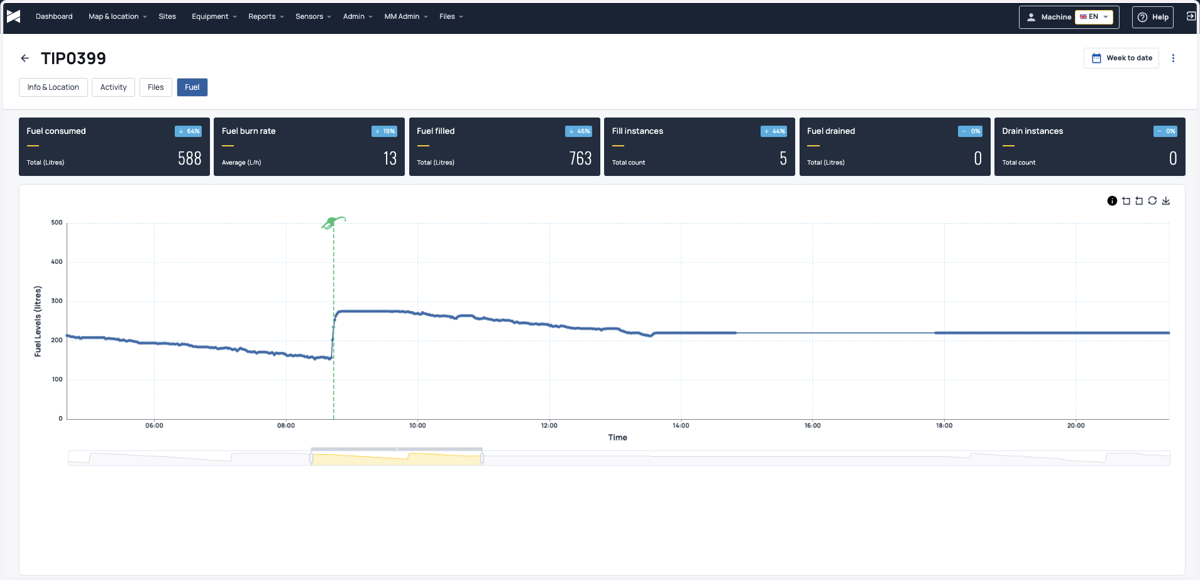
8. Click on zoom reset on the top right of the chart to go to the previous zoom level
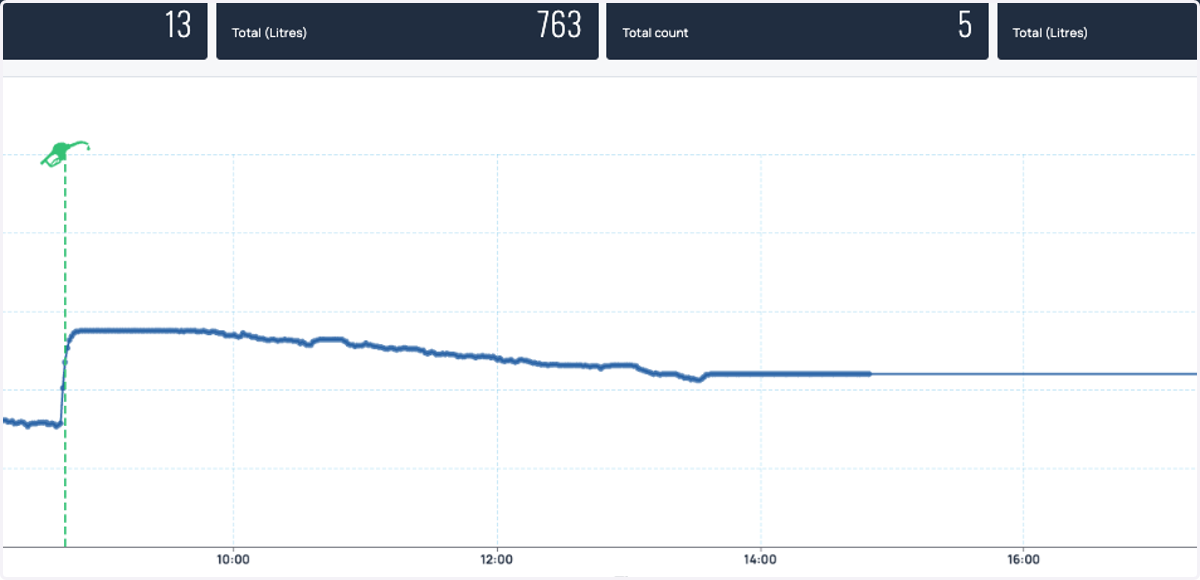
9. Use the slider below to select a range of time by sliding the start and end to a specific time period
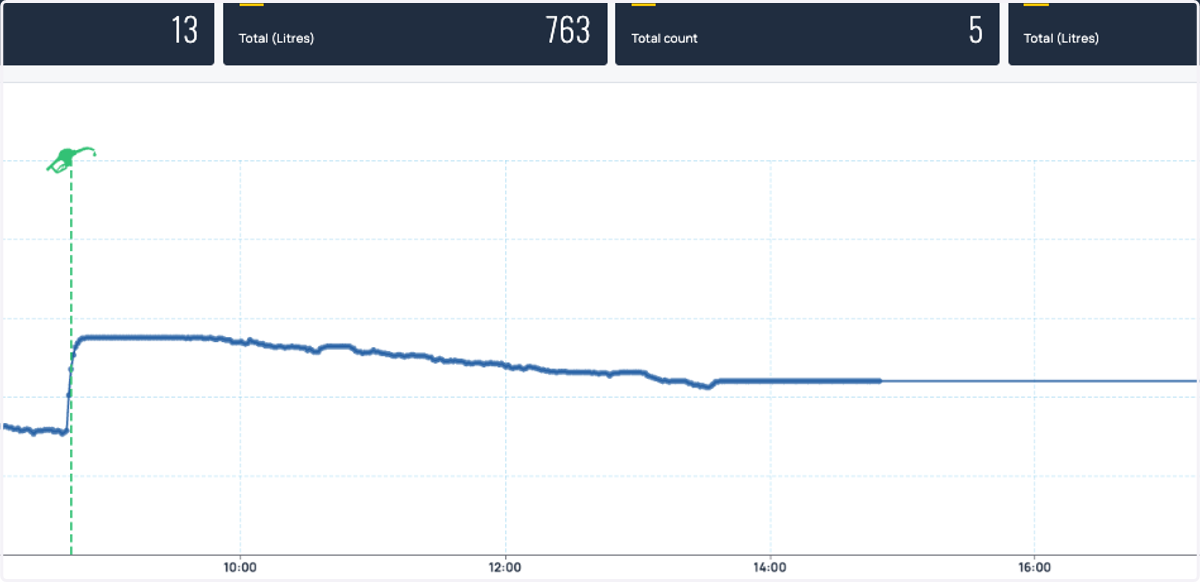
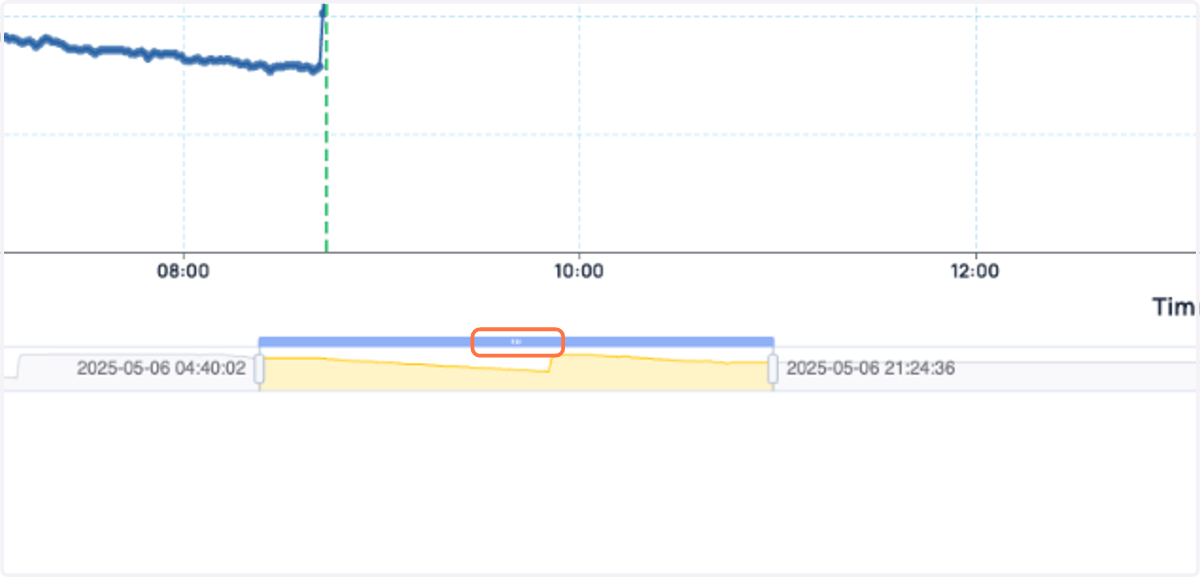
10. You can move the slider left or right by clicking and moving the slider left or right from the top centre of the slider
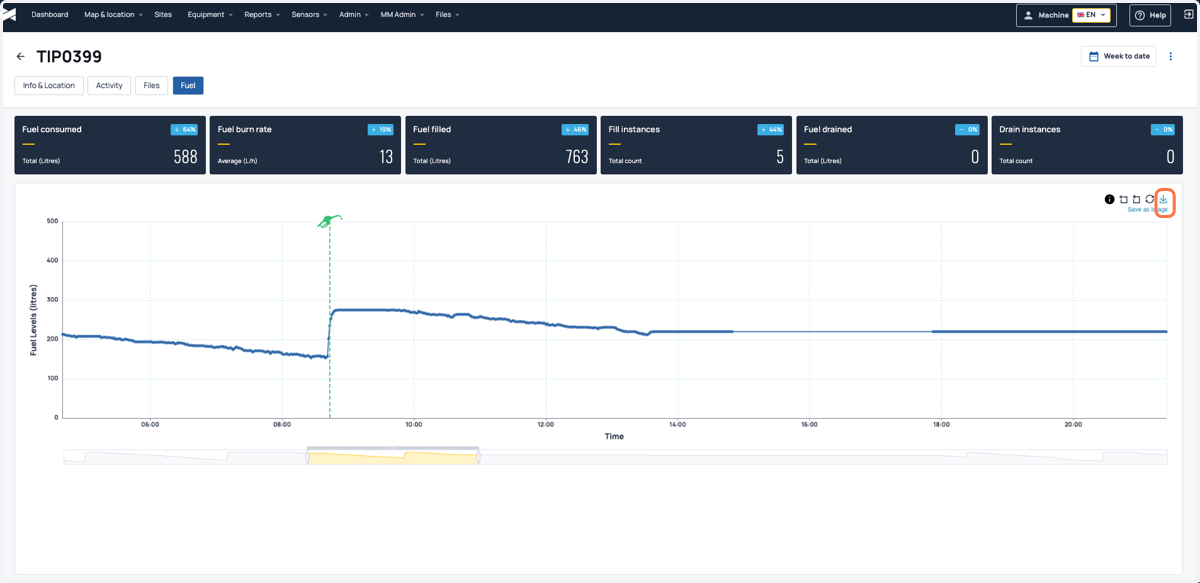
11. You can download the image of a chart(from the zoomed in level itself) by clicking on the save as image button on top right of the fuel chart
12. You can zoom out completely to the original level by clicking on Restore button on the top right