Using the Traffic Heat Map in Affinect
The Traffic Heat Map helps you review visitor activity across different days and venues, identify busier periods, and compare activity over time.
Affinect
1. Understand the Traffic Heat Map
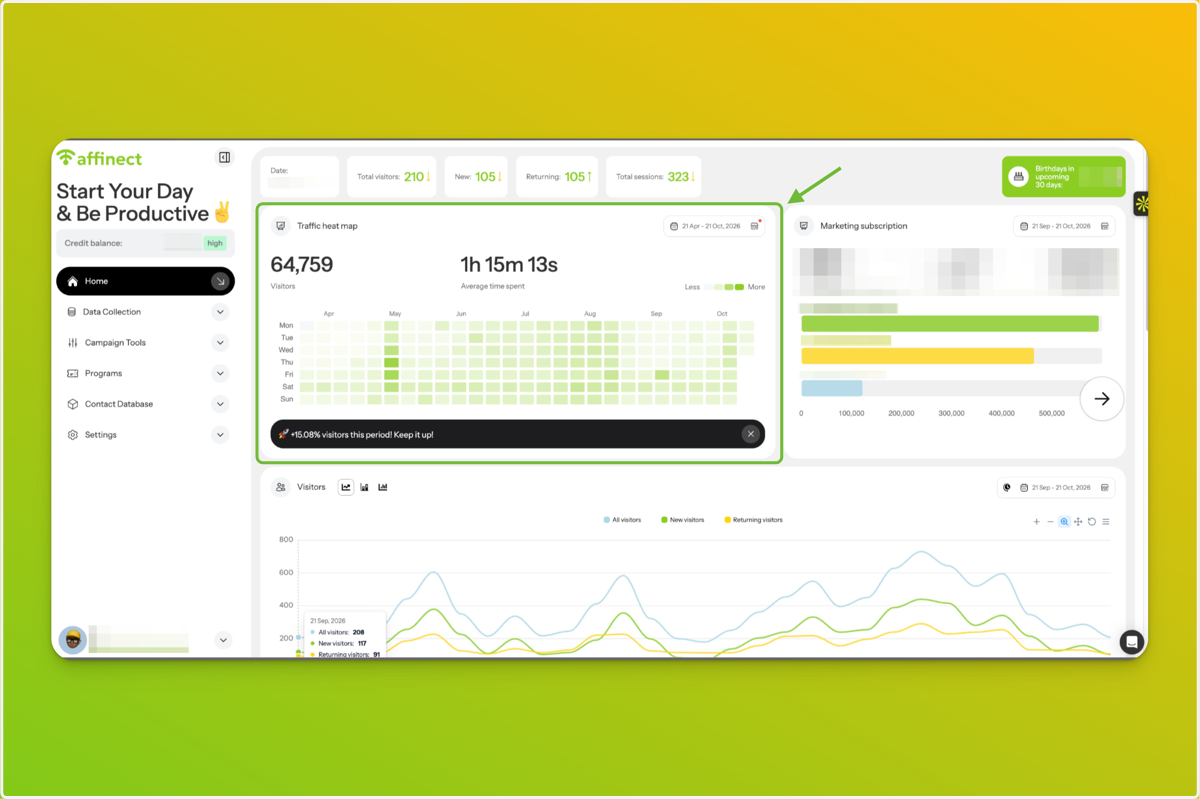
From your Affinect Dashboard, locate the Traffic Heat Map.
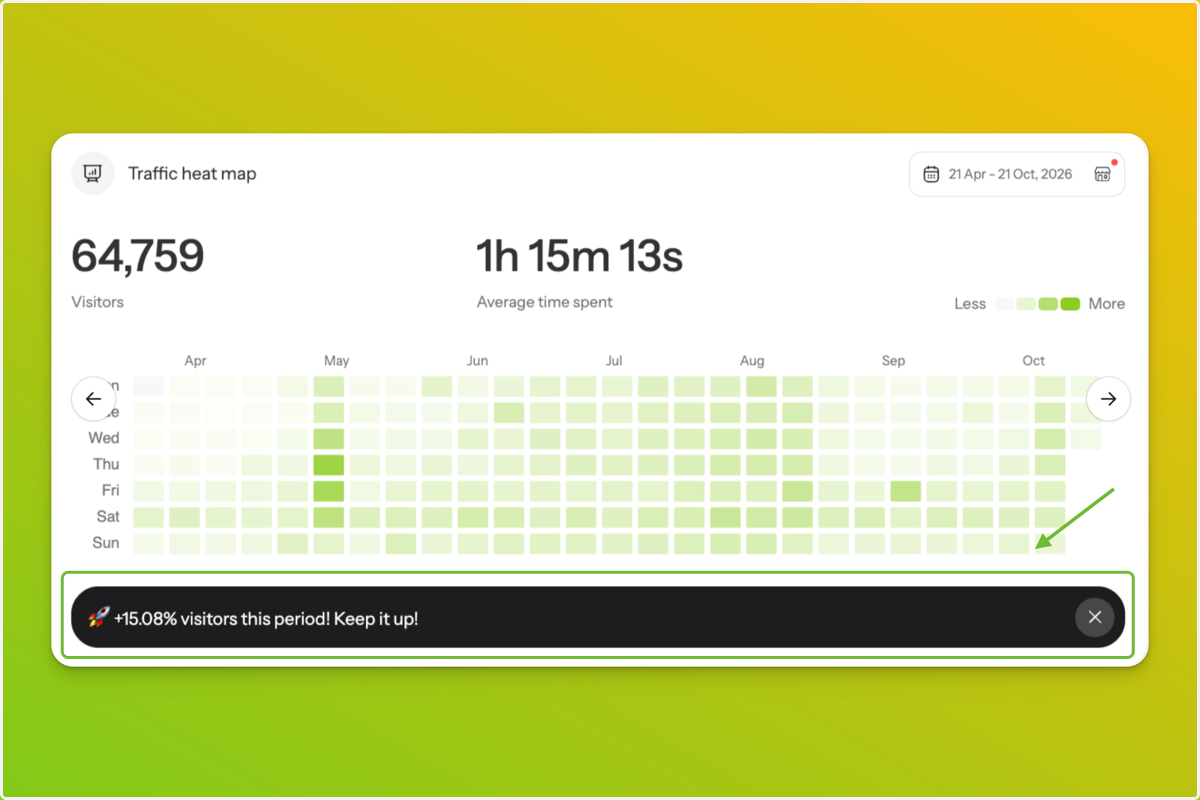
Each square represents a day, with lighter green indicating lower visitor activity and darker green indicating higher activity. Use these patterns to identify busier and quieter days.
2. Review the Visitor Summary
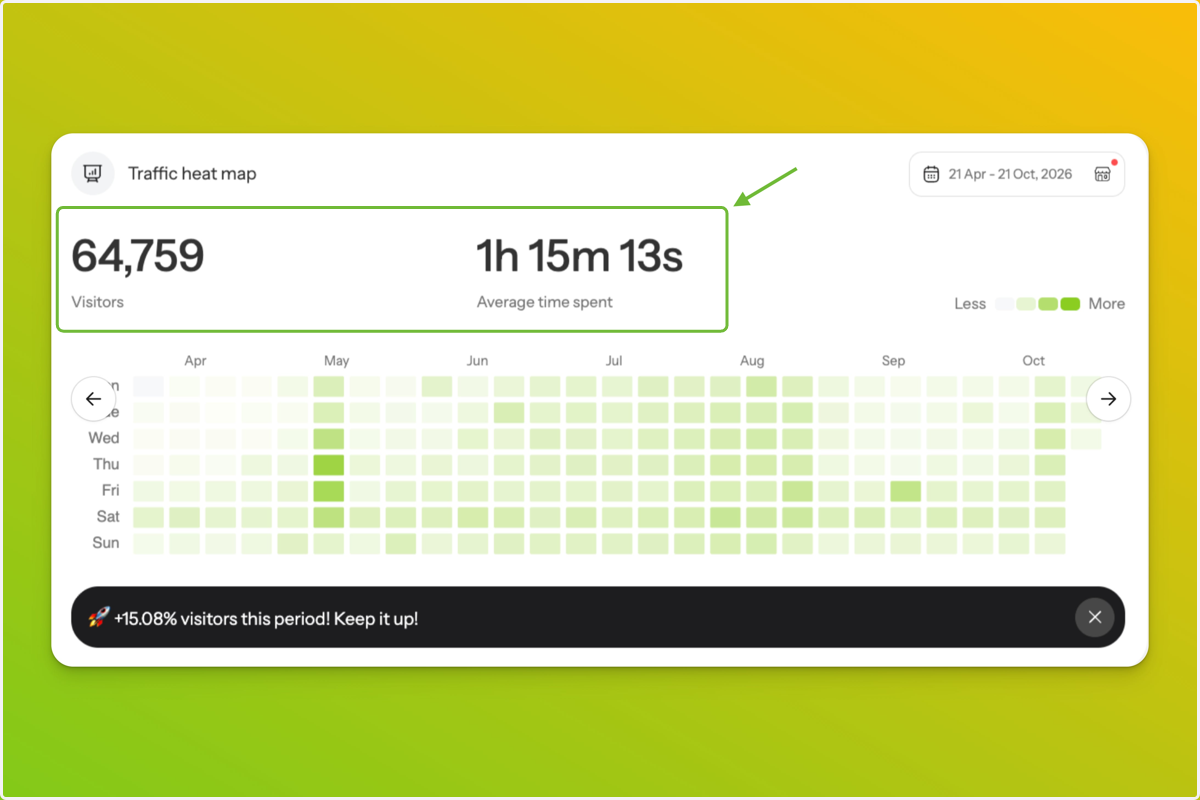
At the top of the Traffic Heat Map, you'll see two metrics:
Visitors: Shows the number of Wi-Fi connections recorded for the selected date range and venues.
Average time spent: Shows the average amount of time visitors remain connected to the venue's Wi-Fi.
Both figures update automatically when you change the date range or selected venues.
3. Check Unique Visits for a Day
Hover over any square on the Traffic Heat Map to see the number of unique visits recorded for that day.
A visitor is counted once per venue per day, even if they connect to the Wi-Fi multiple times.
For example, if a customer connects three times at the same venue on Monday, they count as one unique visit, although three connection sessions may be recorded.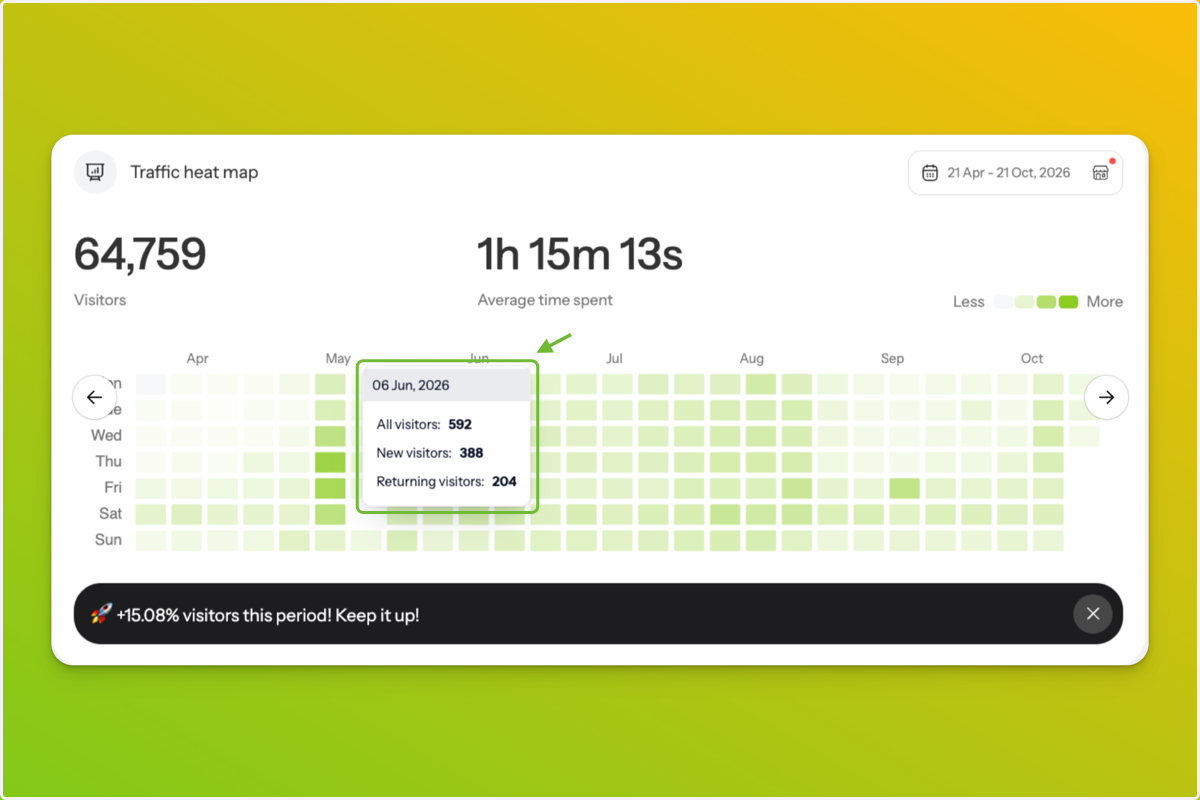
4. Review the Visitor Trend
Below the heat map, a percentage shows how visitor activity has changed compared with the previous period of the same length.
A positive percentage indicates an increase, while a negative percentage indicates a decrease.
5. Select a Date Range
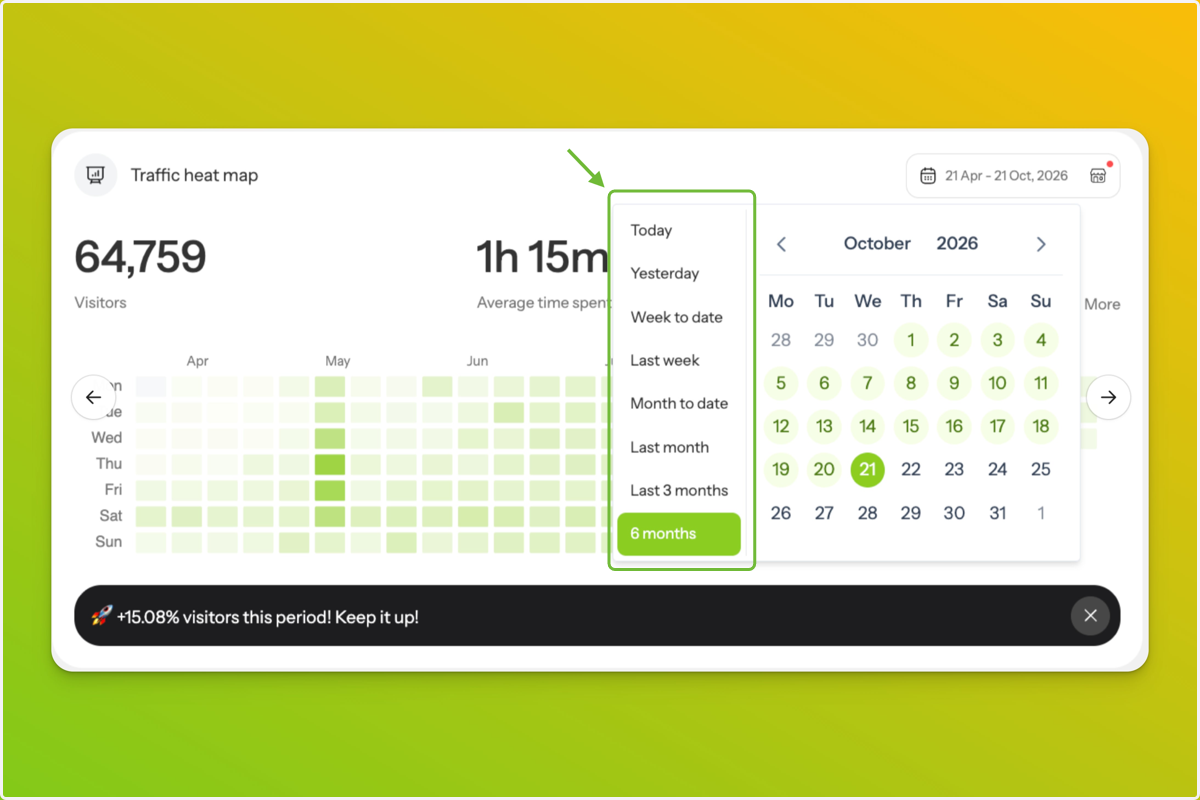
Click the date range at the top-right of the Traffic Heat Map.
Choose from the available presets, including Today, Yesterday, Week to date, Last week, Month to date, Last month, Last 3 months, or 6 months.
The heat map updates automatically when you select a preset.
6. Set a Custom Date Range
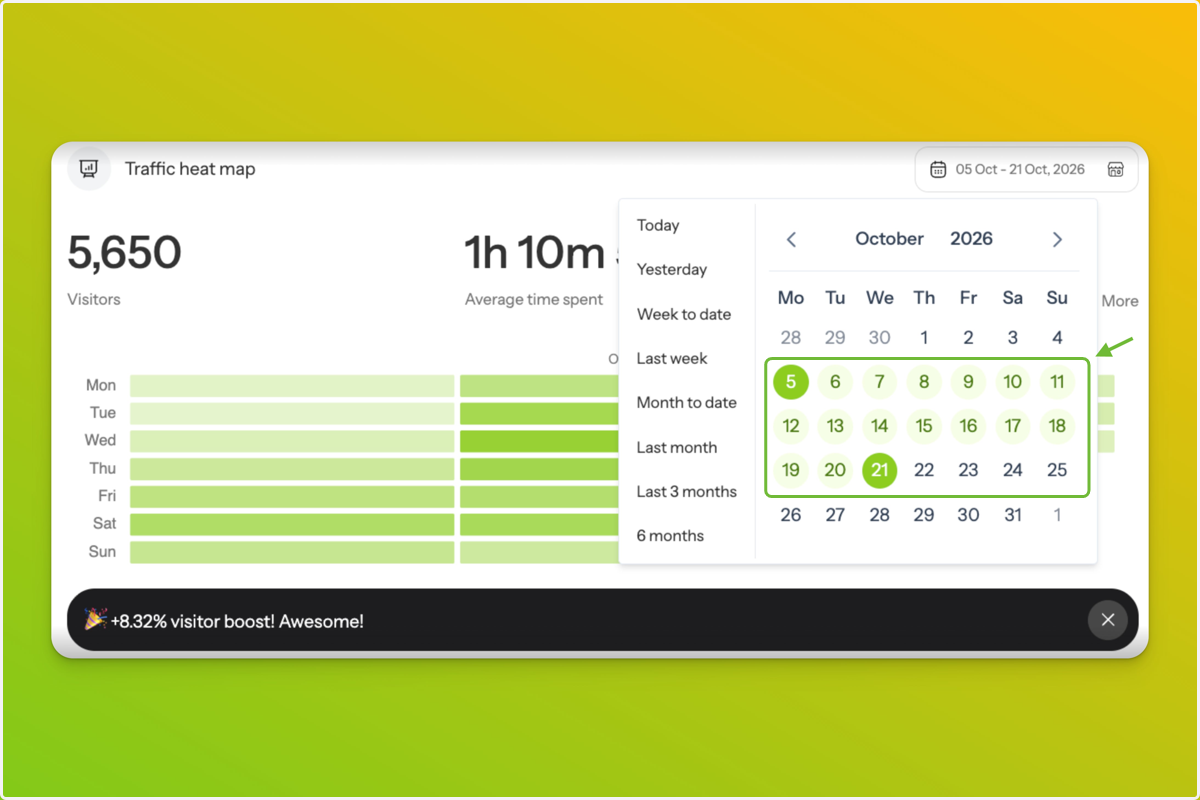
Use the calendar to select your preferred start and end dates.
The Traffic Heat Map updates automatically once the range is selected.
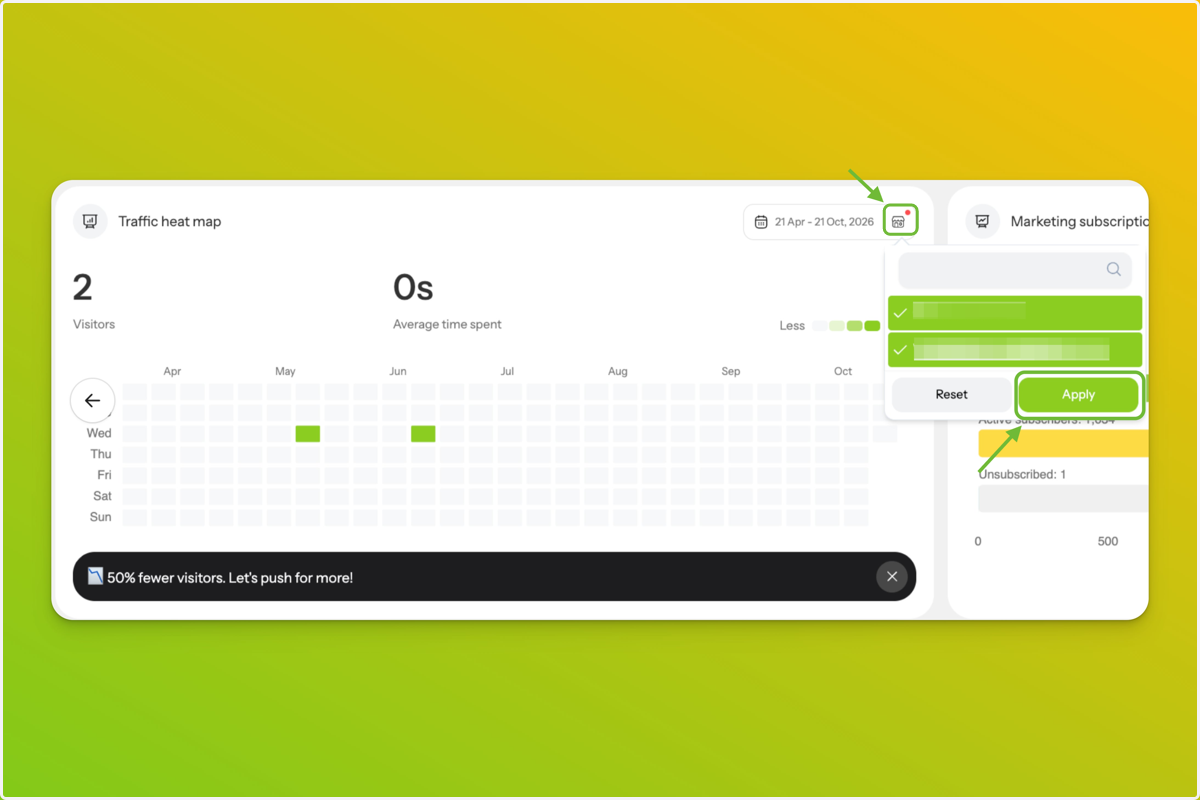
7. Select and Apply Your Venues
Click the venue icon next to the date range to choose which venues to include.
Select one venue to review its activity individually, or multiple venues to view their combined activity.
Click Apply to confirm your selection. The visitor metrics and heat map update to reflect your selected venues.